Daily Snippets
Date: 10th January 2024 |
|
|
Technical Overview – Nifty 50 |
|
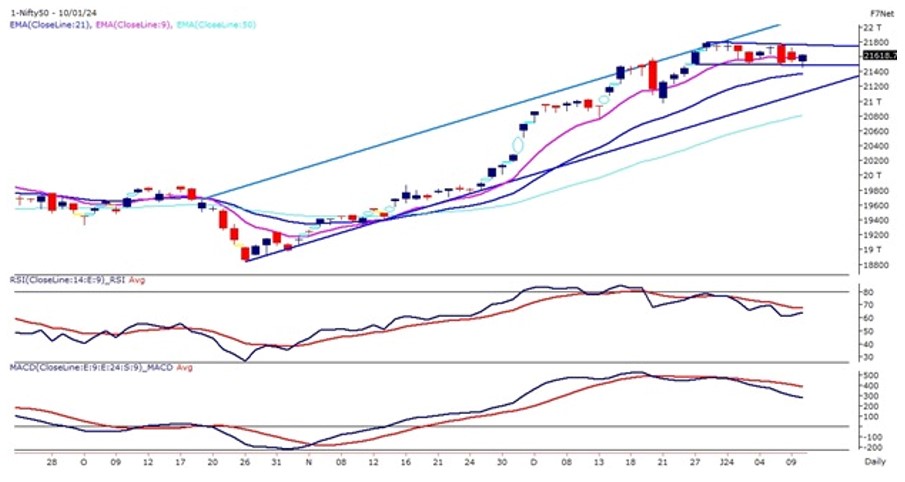
The Benchmark index witnessed a flat opening on 10th January after a continuous bearish setup on the shorter time frame. The prices traded flat for the majority of the time but witnessed a sharp short covering in the final hour of the trade and prices hovered near 12,600 levels.
Strictly speaking, volatility is the major concern for the traders which keeps traders guessing for the trend. The Nifty50 from the past 11 trading sessions is trading within the 300-point range and has formed a narrow rectangle pattern on the daily time frame. The prices are hovering around its 9 EMA and suggesting a sideways trend for the Index.
The momentum oscillator RSI (14) is reading in a lower low lower high formation and the oscillator is reading near 60 levels with bearish crossover. The immediate support for the index is placed near 21,400 and below that near 21,250 levels and resistance is placed near 21,800 levels and above 21,800 bullish breakouts in the Index.
|
Technical Overview – Bank Nifty |
|
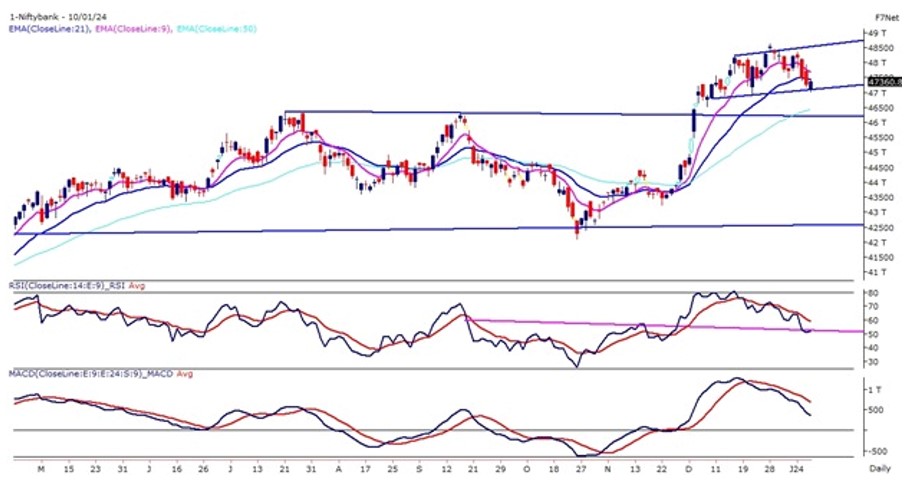
The Banking index witnessed a flat to negative opening on 10th January after a continuous bearish set up on the shorter time frame. The prices traded flat for the majority of the time but witnessed a sharp short covering in the final hour of the trade and prices closed above 47,300 levels.
Strictly speaking, volatility is the major concern for the traders which keeps traders guessing for the trend. The Bank Nifty on the daily chart has taken support near the lower band of the rectangle pattern which was acting as a crucial support for the index.
The momentum oscillator RSI (14) is reading in a lower low lower high formation and the oscillator is reading near 50 levels with a bearish crossover. The immediate support for the Banking index is placed near 47,000 and below that bearish breakdown and resistance is placed near 47,700 levels and above 48,000 are likely to be achievable.
|
Indian markets:
- Domestic equity indices closed higher despite volatility, eyeing CPI inflation data and Q3 earnings.
- Nifty settled above 21,600 levels, rebounding from the day’s low of 21,448.65 earlier in the session.
- Healthcare, IT, and metal shares bolstered the indices, but market direction hinges on upcoming US and Indian inflation figures.
- The spotlight shifts to the impending earnings season, particularly in the IT sector, emphasizing the importance of management insights alongside results scrutiny.
|
Global Markets
- European shares declined while Asian stocks ended mixed on Wednesday, as investors were looking forward for the key US inflation data.
- The global economy is on course to record its worst half decade of growth in 30 years, according to the World Bank. Global growth is forecast to slow for the third year in a row in 2024, dipping to 2.4% from 2.6% in 2023, the bank said in its latest Global Economic Prospects report. The bank warned that without a major course correction,? the 2020s will go down as ?a decade of wasted opportunity.?
- US stock markets were muted on Tuesday. Investors will now focus on a inflation report from the US on Thursday for cues on the timing of the Fed’s rate cut.
- The US trade deficit narrowed in November as imports of consumer goods fell to a one-year low. The trade deficit contracted 2% to $63.2 billion, the Commerce Departments Census Bureau said. Imports declined 1.9%, or $6.1 billion, to $316.9 billion. Exports decreased 1.9%, or $4.8 billion, to $253.7 billion.
|
Stocks in Spotlight
- Reliance Industries witnessed a significant surge, climbing 2.7 percent and reaching an all-time high of Rs 2,658.95 on the BSE. This impressive uptick was fueled by robust trading volumes following Goldman Sachs’ reaffirmed Buy rating. The investment firm cited Reliance’s strong foothold in burgeoning consumer and tech sectors, coupled with a resilient oil to chemical business, as reasons for maintaining their positive stance. Notably, Goldman Sachs revised their 12-month target for Reliance Industries to Rs 2,885 from the previous Rs 2,660, further affirming their bullish outlook on the stock.
- Network 18 Media & Investments surged, hitting a 52-week high of Rs 119.40, locked in a 20 percent upper circuit following a substantial Rs 155.50-crore deal. Approximately 1.3 crore shares, representing 1.3 percent equity, were exchanged, although the parties involved in the transaction were not immediately identified by Moneycontrol. Simultaneously, subsidiary TV18 Broadcast experienced a significant deal, with 1.2 crore shares (0.7 percent equity) traded, amounting to a transaction valued at Rs 78 crore.
- Tata Power saw a 2.5 percent increase, reaching a day’s high of Rs 348 per share, driven by Antique analysts maintaining a ‘buy’ rating and elevating the target price to Rs 450 from Rs 422, indicating a 29 percent potential upside. Over the last month, the company’s stock surged more than 6 percent, outpacing the benchmark Sensex’s 2 percent rise. Earlier on January 5, 2024, Tata Power shares had hit a 52-week high at Rs 349 per share, signaling strong market momentum for this power player.
|
News from the IPO world🌐
- TATA Group initiates talks for public listing of TATA Autocomp Systems
- Firstcry CEO Supam Maheshwari offloaded shares worth Rs. 300 crore before IPO filing
- RK Swamy gets SEBI approval to raise funds
|
|
Day Leader Board
Nifty 50 Top Gainers | Stock | Change (%) | | ADANIENT | ▲ 3.1 | | CIPLA | ▲ 3.1 | | RELIANCE | ▲ 2.9 | | HCLTECH | ▲ 2 | | HEROMOTOCO | ▲ 1.6 |
| Nifty 50 Top Losers | Stock | Change (%) | | DIVISLAB | ▼ -2 | | NTPC | ▼ -2 | | BPCL | ▼ -1.9 | | ONGC | ▼ -1.8 | | POWERGRID | ▼ -1.6 |
| |
Sectoral Performance | Top Sectors | Day change (%) | | NIFTY MEDIA | 3.47 | | NIFTY METAL | 0.95 | | NIFTY CONSUMER DURABLES | 0.66 | | NIFTY IT | 0.5 | | NIFTY HEALTHCARE INDEX | 0.41 |
|
Advance Decline Ratio | Advance/Declines | Day change (%) | | Advances | 2207 | | Declines | 1637 | | Unchanged | 100 |
|
Numbers to track | Indices Name | Latest | % 1D | % YTD | | Dow Jones (US) | 37,525 | (0.4) % | (0.5) % | | 10 Year Gsec India | 7.2 | -0.20% | 0.00% | | WTI Crude (USD/bbl) | 71 | (2.0) % | 0.6 % | | Gold (INR/10g) | 62,211 | 0.10% | -0.90% | | USD/INR | 83.08 | (0.1) % | 0.1 % |
|
|
Please visit www.fisdom.com for a standard disclaimer.
|
