Asset Class & Style Returns
A merry conclusion to 2023 with strong performances across asset classes; growth style dominated in 2023
| 2017 | MSCI EM 37.8% | Growth 28.5% | Small cap 23.2% | DM Equities 23.1% | Value 18.0% | Global REITS 8.0% | Global Agg 7.4% | Cmdty 1.7% |
| 2018 | Global Agg -1.2% | Global REITS -4.9% | Growth -6.4% | DM Equities -8.2% | Value -10.1% | Cmdty -11.2% | Small cap -13.5% | MSCI EM -14.2% |
| 2019 | Growth 34.1% | DM Equities 28.4% | Small cap 26.8% | Global REITs 24.4% | Value 22.7% | MSCI EM 18.9% | Cmdty 7.7% | Global Agg 6.8% |
| 2020 | Growth 34.2% | MSCI EM 18.7% | DM Equities 16.5% | Small cap 16.5% | Global Agg 9.2% | Value -0.4% | Cmdty -3.1% | Global REITs -10.4% |
| 2021 | Global REITs 32.6% | Cmdty 27.1% | Value 22.8% | DM Equities 22.3% | Growth 21.4% | Small cap 16.2% | MSCI EM -2.2% | Global Agg -4.7% |
| 2022 | Cmdty 16.1% | Value -5.8% | Global Agg -16.2% | DM Equities -17.7% | Small cap -18.4% | MSCI EM -19.7% | Global REITs -23.7% | Growth -29.1% |
| 2023 | Growth 37.3% | DM Equities 24.4% | Smallcap 16.3% | Value 12.4% | Global REITs 10.9% | MSCI EM 10.3% | Global Aggregate 5.7% | Cmdty -4.6% |
Source: Bloomberg Barclays, FTSE, LSEG Datastream, MSCI, J.P. Morgan Asset Management. DM Equities: MSCI World; REITs: FTSE NAREIT Global Real Estate Investment Trusts; Cmdty: Bloomberg Commodity Index; Global Agg: Bloomberg Global Aggregate; Growth: MSCI World Growth; Value: MSCI World Value; Small cap: MSCI World Small Cap. All indices are total return in US dollars. Past performance is not a reliable indicator of current and future results. Data as of 31 December 2023
Global Equity Market Performance
Japanese equities shine, S&P 500 makes strong comeback in 2023
| 2017 | MSCI Asia ex-Japan 42.1% | MSCI EM 37.8% | Japan TOPIX 22.2% | US S&P 500 21.8% | MSCI Europe ex-UK 14.5% | UK FTSE All-Share 13.1% |
| 2018 | US S&P 500 -4.4% | UK FTSE All-Share -9.5% | MSCI Europe ex-UK -10.6% | MSCI Asia ex-Japan -14.1% | MSCI EM -14.2% | Japan TOPIX -16.0% |
| 2019 | US S&P 500 31.5% | MSCI Europe ex-UK 27.5% | UK FTSE All-Share 19.2% | MSCI EM 18.9% | MSCI Asia ex-Japan 18.5% | Japan TOPIX 18.1% |
| 2020 | MSCI Asia ex-Japan 25.4% | MSCI EM 18.7% | US S&P 500 18.4% | Japan TOPIX 7.4% | MSCI Europe ex-UK 2.1% | UK FTSE All-Share -9.8% |
| 2021 | US S&P 500 28.7% | MSCI Europe ex-UK 24.4% | UK FTSE All-Share 18.3% | Japan TOPIX 12.7% | MSCI EM -2.2% | MSCI Asia ex-Japan -4.5% |
| 2022 | UK FTSE All-Share 0.3% | Japan TOPIX -2.5% | MSCI Europe ex-UK -12.2% | US S&P 500 -18.1% | MSCI Asia ex-Japan -19.4% | MSCI EM -19.7% |
| 2023 | Japan TOPIX 28.3% | US S&P 500 26.3% | MSCI Europe ex-UK 17.3% | MSCI EM 19.3% | UK FTSE All-Share 7.9% | MSCI Asia ex-Japan 6.3% |
Source: FTSE, LSEG Datastream, MSCI, S&P Global, TOPIX, J.P. Morgan Asset Management. All indices are total return in local currency, except for MSCI Asia ex-Japan and MSCI EM, which are in US dollars. Past performance is not a reliable indicator of current and future results. Data as of 31 December 2023
Global Bond Market Performance
Central bank dynamics and positive trends in fixed income markets during CY2023
| 2017 | Global 7.5% | US 2.3% | UK 2.0% | Spain 1.1% | Italy 0.8% | Japan 0.2% | Germany -1.0% |
| 2018 | Spain 2.5% | Germany 1.9% | Japan 1.0% | US 0.9% | UK 0.5% | Global -0.7% | Italy -1.3% |
| 2019 | Italy 10.6% | Spain 8.3% | UK 7.1% | US 6.9% | Global 5.6% | Germany 3.1% | Japan 1.7% |
| 2020 | Global 9.7% | UK 8.9% | US 8.0% | Italy 7.9% | Spain 4.3% | Germany 3.0% | Japan -0.8% |
| 2021 | Japan -0.2% | US -2.3% | Germany -2.9% | Italy -3.0% | Spain -3.0% | UK -5.3% | Global -5.8% |
| 2022 | Japan -5.4% | US -12.5% | Global -16.8% | Italy -17.2% | Germany -17.4% | Spain -17.5% | UK -25.1% |
| 2023 | Italy 9.3% | Spain 6.9% | Germany 5.7% | Global 4.3% | US 4.1% | UK 3.6% | Japan 0.9% |
Source: Bloomberg Barclays, LSEG Datastream, J.P. Morgan Asset Management. All indices are Bloomberg Barclays benchmark government indices. All indices are total return in local currency, except for global, which is in US dollars. Past performance is not a reliable indicator of current and future results. Data as of 31 December 2023.
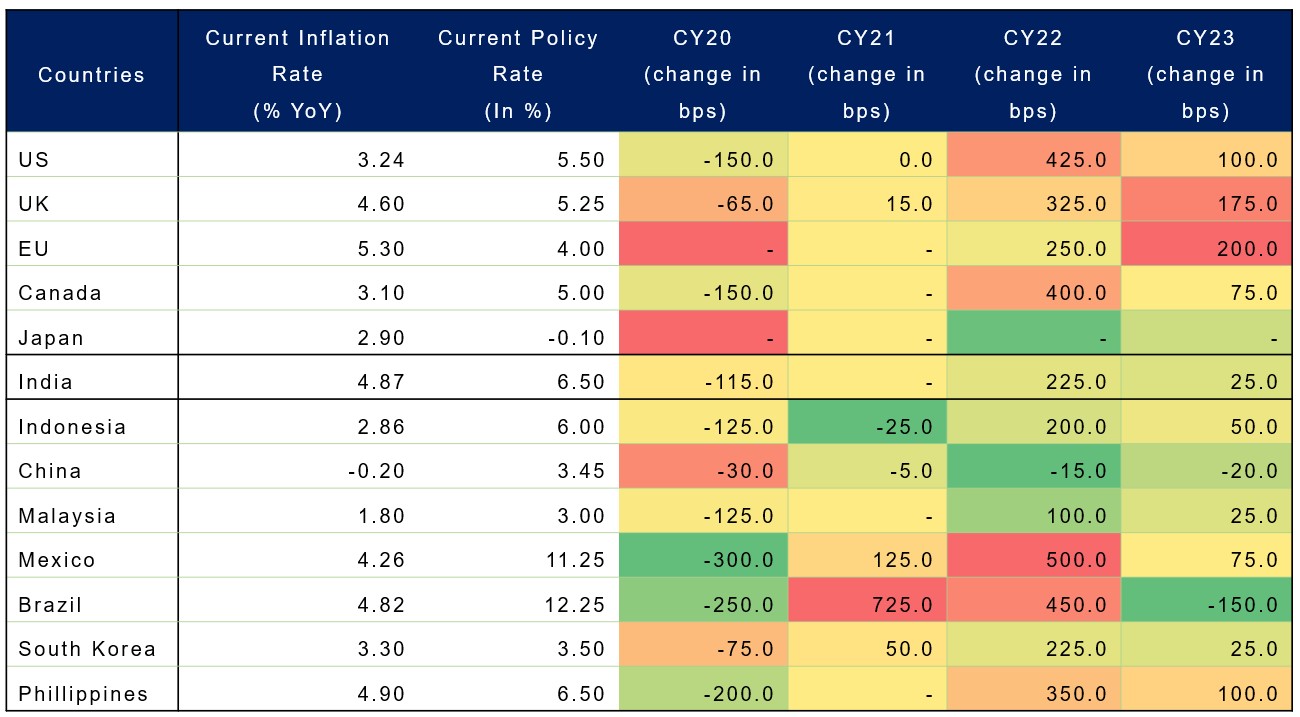
Central Banks Maintain Status Quo
Easing inflation allows global central banks to keep current policies unchanged

Source: ICICI Bank Research, Fisdom Research, Investing, CMIE. Data till dec 06 has been considered


