Daily Snippets
Date: 10th November 2023 |
|
|
Technical Overview – Nifty 50 |
|
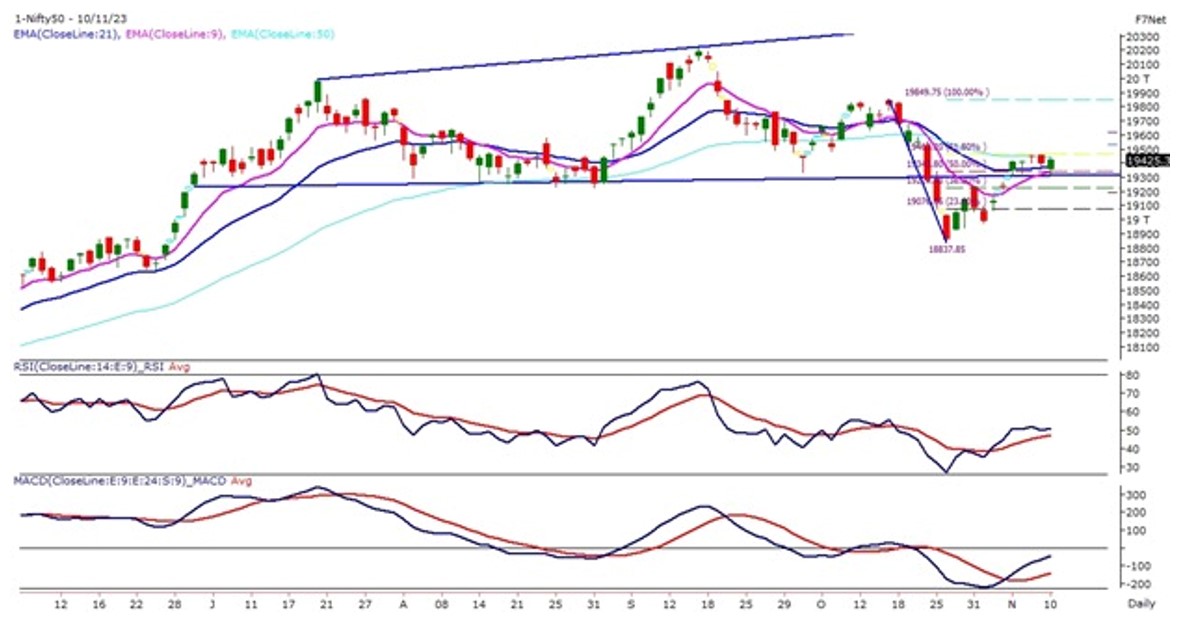
It was a very narrow-range trading week for the Benchmark Index where prices traded within the 250 points range which kept traders guessing for the constructive trend. Nifty50 on the weekly chart has formed a spinning top candle stick pattern which indicates indication among the traders regarding small bets.
On the Monday session, the prices witnessed a gap up opening and created a breakout gap near 19,300 levels, and the prices traded above the breakout gap throughout the week. Nifty swung between gains and losses throughout the week but ended with more than half a percent gain and closed near 19,400 levels.
The index on the daily chart is trading above its 9 & 21 EMA and the RSI (14) is hovering above 50 levels with a bullish crossover. The Nifty on the previous weekly chart has formed a bullish harami candle stick pattern and prices for this week have closed above the high of the pattern, suggest and positive intentions from the traders.
Technically 19,250 – 17,200 will immediately support the index and the upper band is capped below 19,500 – 19,600 Levels for the coming trading sessions.
|
Technical Overview – Bank Nifty |
|
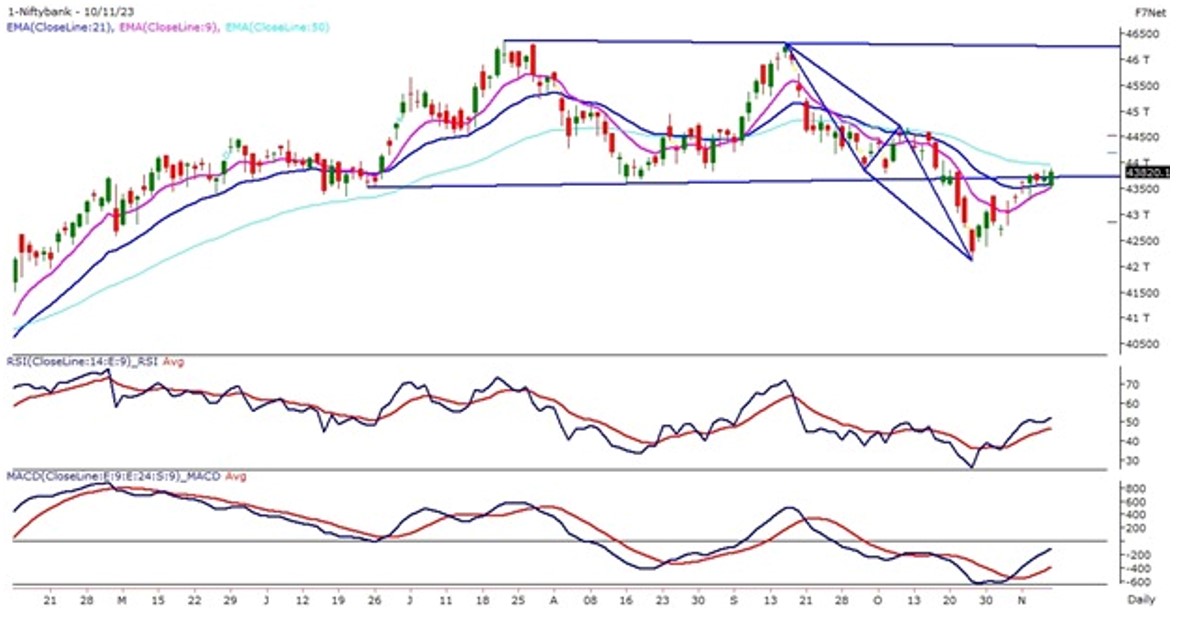
It was a very narrow-range trading week for the Banking Index where prices traded within the 400 points range which kept traders guessing for the constructive trend. The Bank Nifty on the previous weekly chart has formed a bullish harami candle stick pattern and prices for this week have closed above the high of the pattern, suggest and positive intentions from the traders.
The prices on the daily chart have closed above its 9 & 21 EMA which are acting as an immediate pivot level support for the index. The momentum oscillator RSI (14) is hovering above 50 levels from the last few trading sessions which suggests bulls are initiating support from the lower levels to keep the momentum intact.
On the higher side look for a move above 44,000 levels to further upside momentum towards 44,700 levels, similarly on the lower end 43,600 – 43,450 are likely to act as immediate support for the banking Index.
|
Indian markets:
- The stock market experienced a turnaround on Friday, witnessing slight gains after a day of trading in the red.
- The Nifty settled above the 19,400 level, rebounding from the day’s low of 19,329.45 during morning trade.
- The recovery was driven by strength in banking, financials, and oil & gas stocks.
- The broader indices outperformed the benchmarks, showcasing the market’s resilience.
- Expectations of manageable October retail inflation in India and the potential for an upward revision in Q1FY24 GDP growth contributed to the positive sentiment.
- Robust mutual fund flows and the celebratory spirit of Diwali further buoyed the market’s positive outlook.
|
Global Markets
- Markets in Europe and Asian slipped on Friday, reversing small gains from the previous session due to a pessimistic tone set by U.S. markets.
- The decline in U.S. stocks on Thursday put an end to the S&P 500s eight-day winning streak, which had previously resulted in a gain of over 6%. This decline was influenced by hawkish comments made by Federal Reserve Chairman Jerome Powell during an International Monetary Fund conference. Powell emphasized the need for potentially more measures to combat inflation and stated that the Federal Open Market Committee is committed to achieving a monetary policy stance that effectively brings inflation down to 2% over time. He also expressed uncertainty about whether such a stance has been achieved.
|
Stocks in Spotlight
- Eicher Motors, the Indian automaker known for its Royal Enfield motorcycles, announced a robust second-quarter profit, surpassing expectations on Friday. The consolidated net profit surged by 54.7%, reaching 10.16 billion rupees ($122 million) in the three months ending Sept. 30, compared to the same period the previous year. This stellar performance was attributed to strong sales, particularly in response to the growing demand for premium motorcycles. Analysts had anticipated a lower profit of 9.29 billion rupees on average. The results underscore Eicher Motors’ resilience and success in meeting the heightened market demand for its premium motorcycle offerings.
- Page Industries, the licensee for Jockey India, saw a 2% rise on November 10 following positive investor response to the announcement of a second interim dividend of Rs 75 per share, despite a weak second-quarter performance. The company reported a 7.3% decline in consolidated net profit and an 8.3% fall in total revenue year-on-year in Q2FY24. However, the Ebitda margin expanded to 20.8% due to stable raw material prices. The management remains optimistic, stating that challenges in the September quarter were transient, and continued investments in technology would ensure a healthy operating margin.
- Force Motors witnessed a 5 percent upper circuit lock after reporting a substantial surge in revenue for the September-ended quarter. The company’s revenue soared by 42.5 percent year-on-year, reaching Rs 1,802 crore. Concurrently, the profit experienced an impressive nearly five-fold increase, reaching Rs 94 crore. This strong financial performance contributed to the positive investor sentiment, leading to the upper circuit lock on Force Motors’ shares.
|
News from the IPO world🌐
- ESAF Small Finance Bank share debuts at 18.33% premium
- Gandhar Oil Refinery gears up for Rs. 500 crore IPO
- TATA Technology IPO: Company in talks with Morgan Stanley, Blackrock, US Hedge funds
|
|
Day Leader Board
Nifty 50 Top Gainers | Stock | Change (%) | | NTPC | ▲ 1.9 | | ONGC | ▲ 1.7 | | TATACONSUM | ▲ 1.3 | | TECHM | ▲ 1.3 | | ULTRACEMCO | ▲ 1.1 |
| Nifty 50 Top Losers | Stock | Change (%) | | HEROMOTOCO | ▼ -2.1 | | M&M | ▼ -1.8 | | HCLTECH | ▼ -0.9 | | TITAN | ▼ -0.7 | | HINDALCO | ▼ -0.7 |
| |
Sectoral Performance | Top Sectors | Day change (%) | | NIFTY METAL | 0.7 | | NIFTY OIL & GAS | 0.6 | | NIFTY FINANCIAL SERVICES | 0.41 | | NIFTY BANK | 0.31 | | NIFTY PSU BANK | 0.27 |
|
Advance Decline Ratio | Advance/Declines | Day change (%) | | Advances | 1841 | | Declines | 1847 | | Unchanged | 132 |
|
Numbers to track | Indices Name | Latest | % 1D | % YTD | | Dow Jones (US) | 33,892 | (0.7) % | 2.3 % | | 10 Year Gsec India | 7.3 | 0.40% | -0.40% | | WTI Crude (USD/bbl) | 76 | 0.5 % | (1.5) % | | Gold (INR/10g) | 60,271 | 0.40% | 10.00% | | USD/INR | 83.25 | 0.0 % | 0.7 % |
|
|
Please visit www.fisdom.com for a standard disclaimer.
|


