Daily Snippets
Date: 07th November 2023 |
|
|
Technical Overview – Nifty 50 |
|
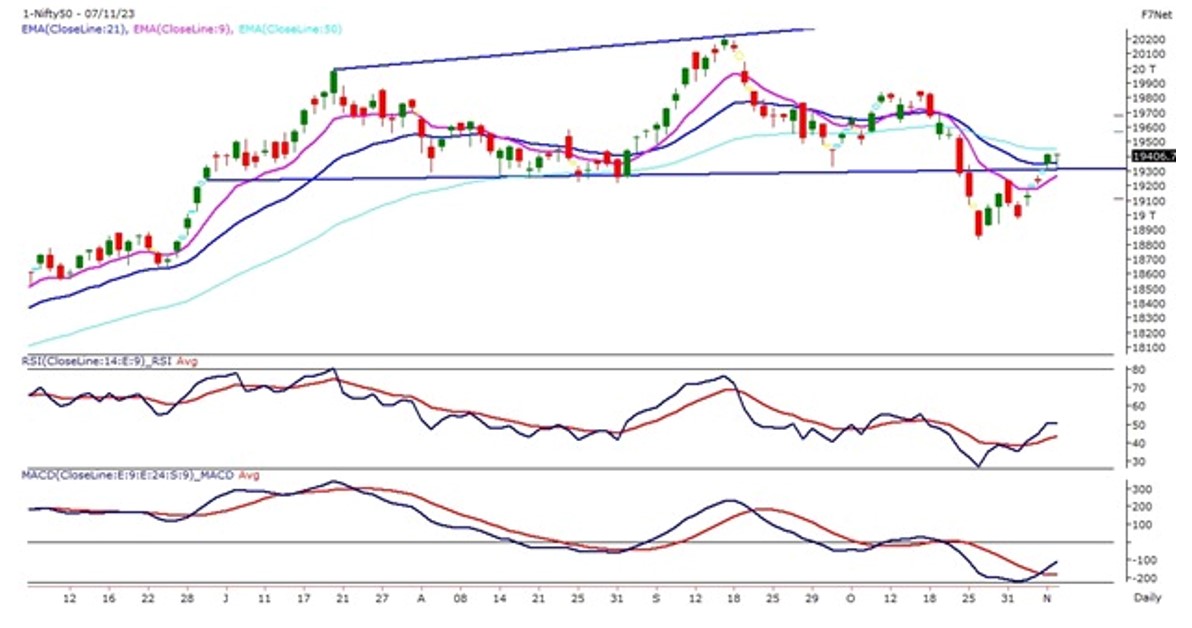
It was a volatile day for the markets where indexes opened marginally gap down but traded above 19,350 levels for the majority of the time with minor jerks and finally pushed higher in the final hour of the trade but struggled near 19,400 levels.
In terms of candle sticks the prices have formed a bullish dragonfly Doji pattern which indicates a strong recovery from the lower levels. The index on the daily chart has spiked upon its 9, 21 & 100 DEMA which is a promising sign of reversal.
From a technical perspective, resuming the bullish trend with gaps is positive, but further momentum is needed to reinforce this trend. On the higher side look for a move above 19,500 levels to further upside momentum towards 19,650 levels, similarly on the lower end 19,300 – 19,250 are likely to act as immediate support for the Index.
|
Technical Overview – Bank Nifty |
|
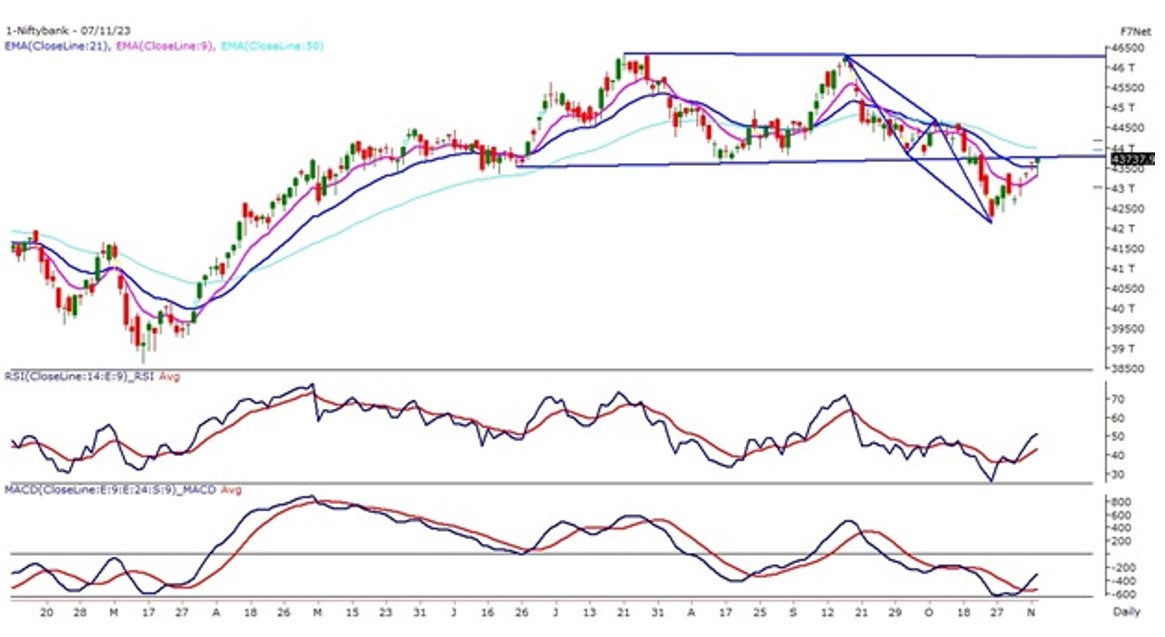
It was a volatile day for the Banking Index where indexes opened a gap down but traded above 43,300 levels for the majority of the time with minor jerks and finally pushed higher in the final hour of the trade but struggled near 43,750 levels.
In terms of candle sticks the prices have formed a bullish Hammer pattern which indicates a strong recovery from the lower levels. The banking index on the daily chart has spiked upon its 9, & 21 DEMA which is a promising sign of reversal.
From a technical perspective, resuming the bullish trend with gaps is positive, but further momentum is needed to reinforce this trend. On the higher side look for a move above 44,000 levels to further upside momentum towards 44,700 levels, similarly on the lower end 43,250 – 43,100 are likely to act as immediate support for the banking Index.
|
Indian markets:
- Equity indices exhibited a downward trend in a volatile trading session but managed to recover most losses, showcasing significant resilience.
- Cautious sentiment due to state elections and negative global cues, including a decline in Chinese exports, led to market resistance.
- The market remained range-bound, but a surge in buying during the final hour helped overcome initial setbacks.
- The pharma sector performed strongly, while profit booking was observed in the real estate segment. Specific movements were noted in IT and metal stocks.
- Mid and small-cap stocks outperformed the major index, indicating notable market dynamics during the session.
|
Global Markets
- The Dow Jones index futures were down 96 points, indicating a weak opening in the US stocks today.
- European and Asian stocks tumbled on Tuesday, as Federal Reserve warnings and concerns over Chinas economic conditions affected market sentiment. The Reserve Bank of Australia also raised interest rates as expected, indicating a less favorable inflation outlook.
- Minneapolis Fed President Neel Kashkaris comments tempered optimism about the Feds potential end to their tightening cycle this year.
- Chinas exports contracted more than expected in October and their trade surplus reached a 17-month low. While imports unexpectedly increased, the decline in exports signifies ongoing struggles for Chinas exporters, primarily due to weakening demand in Western countries. This weakness in China has negative implications for broader Asian markets that rely on China as a key trading partner. Chinese inflation data later in the week is expected to provide further insights into the situation.
- US stocks eked out small gains on Monday as hopes continued to prevail that the Federal Reserve is ready to call an end to tightening. Office-sharing company WeWork filed for Chapter 11 bankruptcy protection in New Jersey federal court Monday. The company reported liabilities ranging from $10 billion to $50 billion, according to a bankruptcy filing.
|
Stocks in Spotlight
- Atul Limited’s shares declined by 2.08 percent following the company’s announcement of a buyback program not exceeding Rs 50 crore, as stated in an exchange filing. The maximum buyback price has been capped at Rs 7,500 per share, indicating an 11 percent premium over the previous day’s closing price. The buyback covers a maximum of 66,666 shares, equivalent to 0.23 percent of the company’s total equity shares.
- V-Mart Retail witnessed a 2.39 percent decrease in its shares, dropping to Rs 1,663.1 at 12:37 pm, following a significant widening of losses in the July-September quarter of FY24. The company’s losses surged nearly sixfold, escalating from Rs 13 crore to Rs 64 crore during this period. Despite a 9 percent year-on-year growth in revenue to Rs 549 crore in Q2FY24, the earnings before interest, tax, depreciation, and amortization plummeted by 98 percent to Rs 1 crore. V-Mart Retail attributed this decline to a shift in the festive period from Q2 to Q3, causing the delay in Durga Puja and Dusshera sales, thereby impacting the company’s financial performance.
- RR Kabel stock surged by over 4 percent following the company’s robust performance in Q2 FY24. During the quarter ending in September, the company’s net profit more than doubled, reaching Rs 74.09 crore. RR Kabel also reported a substantial 17.7 percent year-on-year increase in second-quarter revenue, totaling Rs 1609.7 crore. Additionally, the company’s EBITDA experienced a remarkable growth of 92.7 percent from the previous year, amounting to Rs 121.1 crore.
|
News from the IPO world🌐
- Cello World makes a bumper debut on listing day!
- Accent Microcell files draft papers with NSE Emerge to float public offer
- ESAF Small Finance Bank IPO subscribed 8.31 times on day 2
|
|
Day Leader Board
Nifty 50 Top Gainers | Stock | Change (%) | | SUNPHARMA | ▲ 2 | | BPCL | ▲ 1.7 | | NTPC | ▲ 1.6 | | DRREDDY | ▲ 1.4 | | INDUSINDBK | ▲ 1.1 |
| Nifty 50 Top Losers | Stock | Change (%) | | HEROMOTOCO | ▼ -1 | | BAJFINANCE | ▼ -0.8 | | JSWSTEEL | ▼ -0.8 | | DIVISLAB | ▼ -0.7 | | RELIANCE | ▼ -0.7 |
| |
Sectoral Performance | Top Sectors | Day change (%) | | NIFTY PHARMA | 1.32 | | NIFTY HEALTHCARE INDEX | 1.02 | | NIFTY OIL & GAS | 0.66 | | NIFTY PSU BANK | 0.46 | | NIFTY PRIVATE BANK | 0.39 |
|
Advance Decline Ratio | Advance/Declines | Day change (%) | | Advances | 1929 | | Declines | 1760 | | Unchanged | 124 |
|
Numbers to track | Indices Name | Latest | % 1D | % YTD | | Dow Jones (US) | 34,061 | 0.7 % | 2.8 % | | 10 Year Gsec India | 7.3 | -0.20% | 0.10% | | WTI Crude (USD/bbl) | 81 | (2.4) % | 4.7 % | | Gold (INR/10g) | 60,829 | 0.00% | 10.00% | | USD/INR | 83.25 | (0.0) % | 0.7 % |
|
|
Please visit www.fisdom.com for a standard disclaimer.
|


