Daily Snippets
Date: 06th November 2023 |
|
|
Technical Overview – Nifty 50 |
|
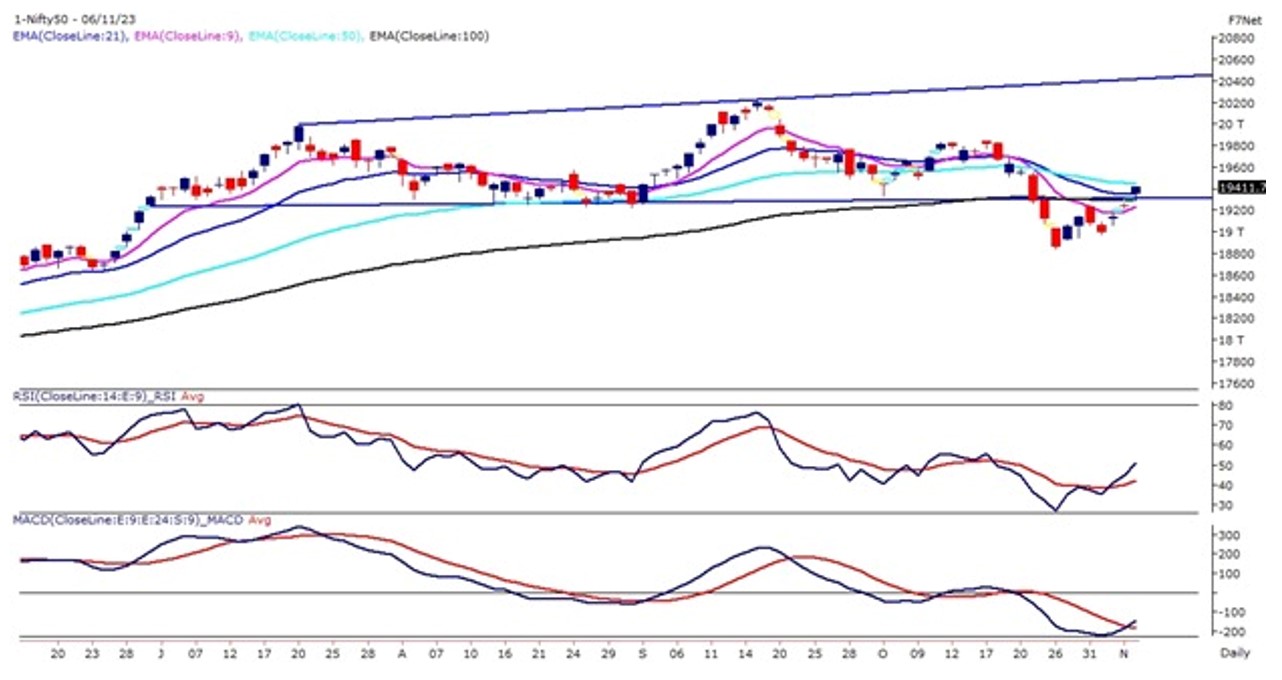
The benchmark index on 6th November again witnessed a gap-up opening above 19,300 levels and traded above the same to considered a positive closing for the day. It’s the third time in the last 5 trading sessions that prices witnessed a gap opening and sustained their opening bullish stance.
Nifty has experienced a shape reversal from the demand zone identified around the previous all–time high of 18,887 levels. The index on the daily chart has spiked upon its 9, 21 & 100 DEMA which is a promising sign of reversal. On the 60 mins chart, the prices have given a triangle pattern breakout which is a bullish sign for the short term.
From a technical perspective, resuming the bullish trend with gaps is positive, but further momentum is needed to reinforce this trend. On the higher side look for a move above 19,500 levels to further upside momentum towards 19,650 levels, similarly on the lower end 19,300 – 19,250 are likely to act as immediate support for the Index.
|
Technical Overview – Bank Nifty |
|
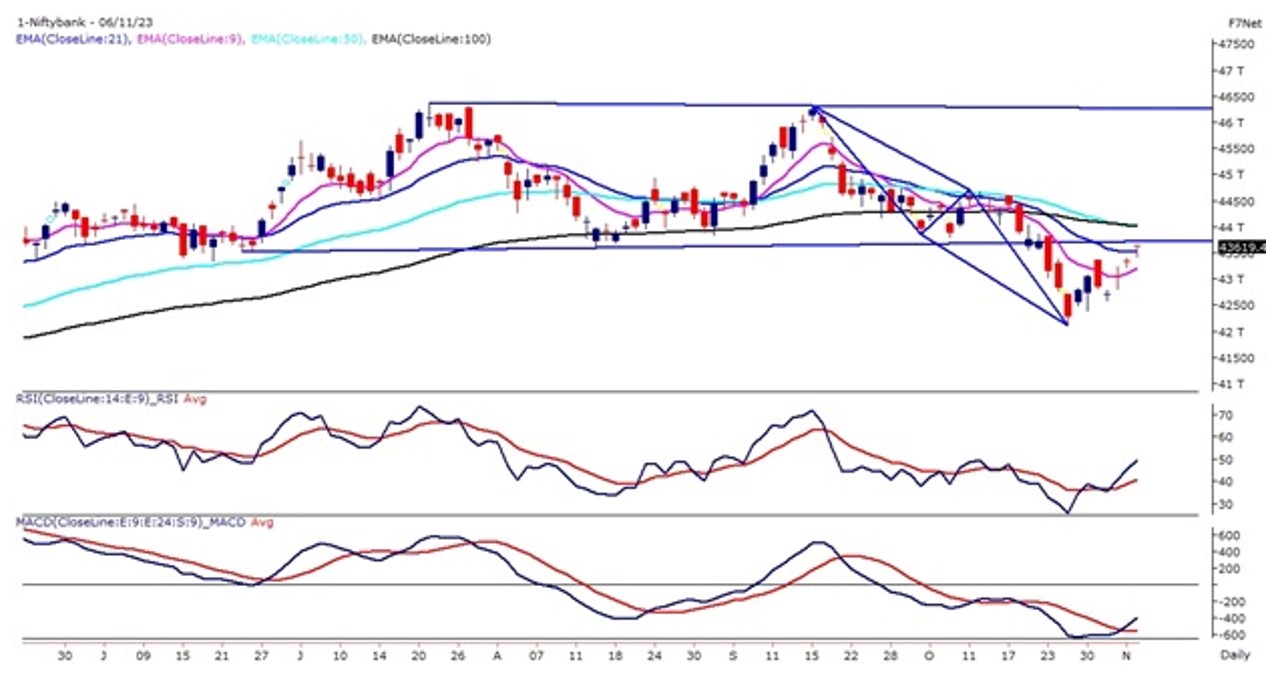
The Bank Nifty on the weekly chart has formed a bullish harami candle stick pattern and the prices have started trading above the high of the pattern on the first day of the trading week. The Banking index witnessed a positive gap-up opening on 6th November
It’s the third time in the last 5 trading sessions that prices witnessed a gap opening and sustained their opening bullish stance. The index on the daily chart has spiked upon its 9, & 21 DEMA which is a promising sign of reversal. The momentum oscillator RSI (14) has formed an intermediate bottom near 30 levels and post that signals a reversal from the lower levels.
From a technical perspective, resuming the bullish trend with gaps is positive, but further momentum is needed to reinforce this trend. On the higher side look for a move above 44,000 levels to further upside momentum towards 44,700 levels, similarly on the lower end 43,250 – 43,100 are likely to act as immediate support for the banking Index.
|
Indian markets:
- Domestic equity benchmarks posted strong gains on Monday, marking the third consecutive day of increases.
- The Nifty closed above the 19,400 level, indicating a positive trend in the market.
- Metal, pharma, and oil & gas stocks were the top performers, leading the gains, while PSU banks and consumer durable stocks showed slower growth.
- Among sectoral indices, Nifty Metal index (up 1.36%), Nifty Oil & Gas index (up 1.28%), and Nifty Pharma index (up 1.28%) outperformed the Nifty50 index.
- In contrast, the FMCG index (down 0.34%), the IT index (down 0.63%), and the Media index (down 0.67%) performed below the Nifty 50 index, showing weaker performance in those sectors.
|
Global Markets
- Markets in Europe declined while Asian stocks advanced on Monday after a soft monthly jobs report from the US helped ease bets that the Federal Reserve will continue to hike interest rates.
- US stocks closed higher on Friday after a soft jobs report drove bond yields lower. The October jobs report on Friday came in weaker than expectations, showing the Fed?s attempt to cool the economy and stifle inflation could be working. The U.S. economy last month added 150,000 jobs, lower than September?s blowout of 297,000 jobs added. The unemployment rate rose to 3.9%.
|
Stocks in Spotlight
- Vedanta experienced a marginal increase of 0.13% in its stock price. The company disclosed a consolidated net loss of Rs 915 crore in Q2 FY24, a significant drop from the net profit of Rs 3,308 crore in Q2 FY23. Despite the loss, Vedanta’s income from operations saw a 16% YoY rise to Rs 38,546 crore for the quarter. This growth was attributed to higher sales volume and a favorable arbitration award in oil and gas, although it was partially mitigated by a decline in output commodity prices.
- Shipping Corporation of India witnessed a significant decline of 4.39 percent in its stock price following the company’s announcement of a 42.5 percent year-on-year decrease in net profit for Q2 FY24, amounting to Rs 65.7 crore. Additionally, revenue from operations plummeted by nearly 23 percent, reaching Rs 1,093.2 crore compared to the previous fiscal year.
- Interglobe Aviation experienced a 1.95 percent increase in its stock price as brokerages reaffirmed their optimistic outlook on the company. This endorsement came after a robust performance in the September quarter, even during a traditionally slow period. Despite the seasonal challenges, Interglobe Aviation’s positive showing prompted bullish sentiments among brokers, leading to the uptick in its stock value.
|
News from the IPO world🌐
- Cello World makes a bumper debut on listing day!
- Accent Microcell files draft papers with NSE Emerge to float public offer
- Portean eGov Technologies IPO fully booked on Day 1
|
|
Day Leader Board
Nifty 50 Top Gainers | Stock | Change (%) | | DIVISLAB | ▲ 5.1 | | EICHERMOT | ▲ 2.6 | | HEROMOTOCO | ▲ 2.6 | | AXISBANK | ▲ 2.1 | | LT | ▲ 2.1 |
| Nifty 50 Top Losers | Stock | Change (%) | | SBIN | ▼ -0.7 | | HINDUNILVR | ▼ -0.5 | | CIPLA | ▼ -0.3 | | TATAMOTORS | ▼ -0.2 | | TITAN | ▼ -0.1 |
| |
Sectoral Performance | Top Sectors | Day change (%) | | NIFTY REALTY | 2.54 | | NIFTY MEDIA | 1.38 | | NIFTY CONSUMER DURABLES | 1.22 | | NIFTY OIL & GAS | 0.77 | | NIFTY HEALTHCARE INDEX | 0.75 |
|
Advance Decline Ratio | Advance/Declines | Day change (%) | | Advances | 2422 | | Declines | 1381 | | Unchanged | 181 |
|
Numbers to track | Indices Name | Latest | % 1D | % YTD | | Dow Jones (US) | 34,061 | 0.7 % | 2.8 % | | 10 Year Gsec India | 7.3 | -0.20% | 0.10% | | WTI Crude (USD/bbl) | 81 | (2.4) % | 4.7 % | | Gold (INR/10g) | 60,829 | 0.00% | 10.00% | | USD/INR | 83.25 | (0.0) % | 0.7 % |
|
|
Please visit www.fisdom.com for a standard disclaimer.
|


