Daily Snippets
Date: 27th October 2023 |
|
|
Technical Overview – Nifty 50 |
|
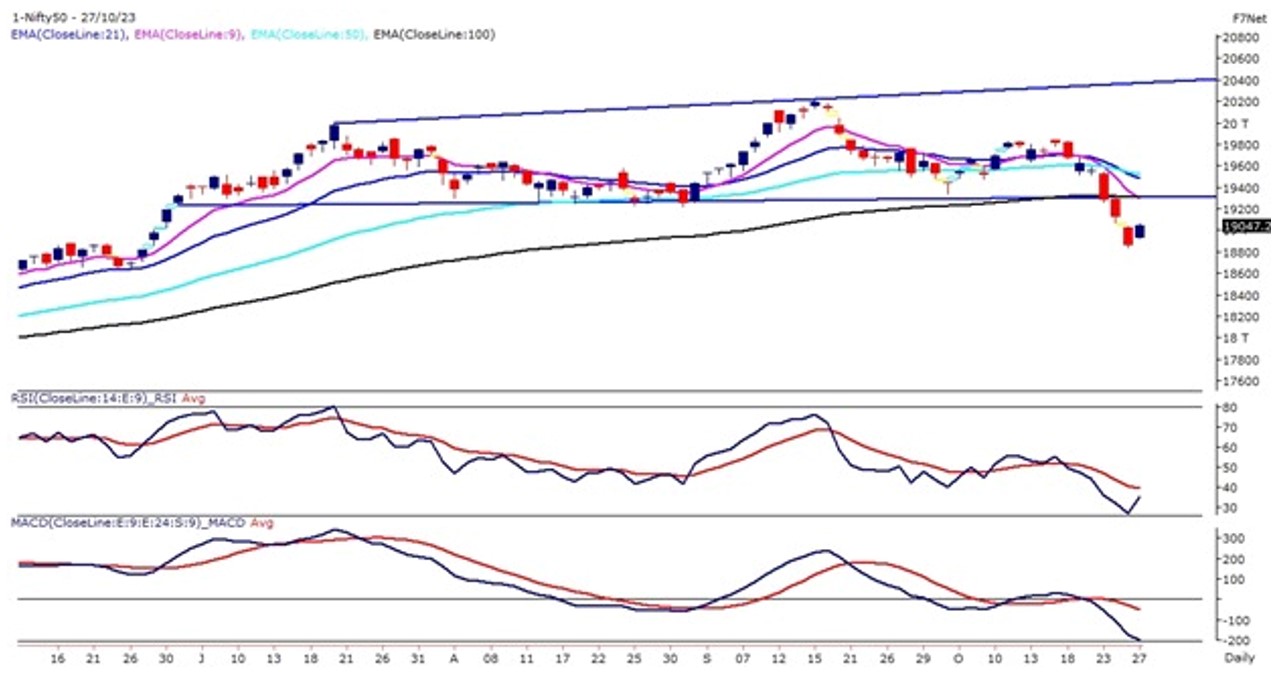
The Benchmark witnessed a gap-up opening at the start of November month expiry following the global peers in the early traders. The index closed in green above 19,000 levels after 6 consecutive days of selling. The index has formed a tall red candle on the weekly chart with a loss of more than 2.50% suggesting it was a sellers-oriented week.
Nifty will start the November series with an open interest of 1.16 crore shares compared to an OI of 1.04 crore at the beginning of the October series. Nifty saw significantly higher rollover with a higher cost of carry (+0.57%) and a sharp rise in open interest, compared to its previous month, indicating carry forward of short positions to the November series.
Nifty fell 3.42% during the October month expiry. Nifty futures rollover stood at 83.39%, significantly higher than last month’s expiry rollover of 76.00% and its three-month average of 79.14%. The Put-Call Ratio, a sentiment indicator, too, fell sharply from 1.44 on 29th September to 0.61 on 26th October indicating call writers’ dominance throughout the October series.
Today’s rally in the Nifty can be considered a pullback towards its breakdown levels. The immediate hurdle for the index is placed at 19,100 – 19,150 levels and a drift below 18,800 levels will trigger a further weakness in the prices.
|
Technical Overview – Bank Nifty |
|
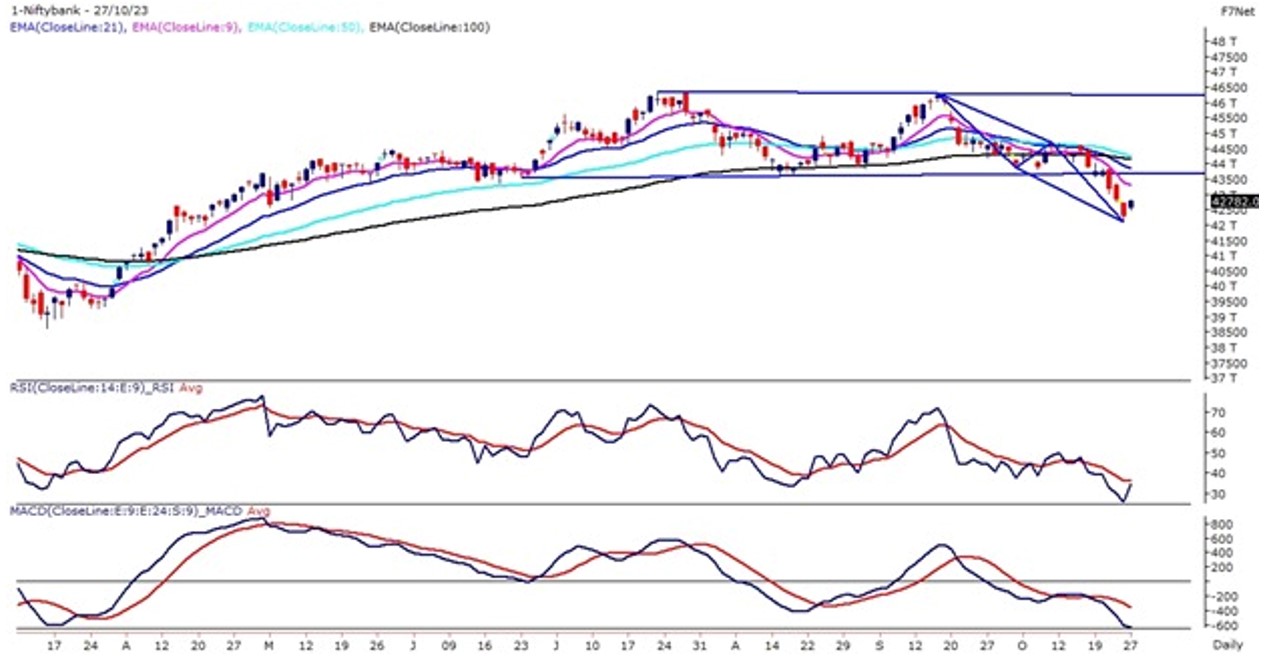
The Bank Nifty on the daily chart has formed a bullish ABCD Harmonic pattern and respected its potential reversal zone by witnessing a positive closing near 42,800 levels. On the weekly time frame, prices have formed a tall bearish candle and closed more than 2% lower.
The Banking index at the start of November month expiry witnessed a gap up opening and the positive bias was sustained throughout the day. The momentum oscillator RSI (14) has made an immediate bottom near 25 levels and moved higher but still closed below its average.
On the weekly chart, the Banking Index is trading in a rising wedge pattern and prices are trading near the lower band of the pattern. The prices just closed above its 50 WEMA which is placed at 42,800 levels and is likely to act as an important pivot level.
Today’s rally in Banking stocks can be considered a pullback toward its breakdown levels. The immediate hurdle for the index is placed at 43,300 – 43,500 levels and a drift below 42,100 levels will trigger a further weakness in the prices.
|
Indian markets:
- The stock market ended its six-day losing streak and rebounded, driven by strategic bargain hunting.
- The Nifty 50 index showed strength, surpassing the 19,000 level, propelled by a widespread market rally.
- Notable gains were observed in PSU banks, media, and realty shares, indicating a positive market sentiment.
- The surge in value buying was influenced by optimistic vibes from the recovery in other Asian markets.
- Despite the market upswing, traders remained cautious due to ongoing concerns related to the Israel-Hamas conflict, escalating US bond yields, outflows from FII funds, and apprehensions regarding potential rate hikes in the near future.
|
Global Markets
- European shares fell across the board while Asian stocks advanced on Friday in an attempt to rebound from sharp losses previously.
- US stocks tumbled on Thursday, dragged by tech and tech-adjacent megacap shares as investors digested mixed quarterly earnings and signs of economic resiliency that could encourage the Federal Reserve to keep interest rates at a restrictive level longer than expected. U.S. data overnight showed the U.S. economy grew almost 5% in the third quarter.
- Overnight, the European Central Bank left interest rates unchanged as expected. ECB President Christine Lagarde told a press conference the euro zone economy was weak but stressed that price pressures remained strong and could be aggravated further if the Middle East conflict pushed energy costs higher.
|
Stocks in Spotlight
- Canara Bank witnessed a remarkable 6 percent surge in its stock value following the announcement of a substantial 42.8 percent increase in its net profit, which amounted to Rs 3,606 crore during the second quarter of FY24. Additionally, the bank’s net interest income demonstrated strong growth, surging by almost 20 percent to reach Rs 8,903 crore in the same quarter.
- Phoenix Mills experienced a nearly 4 percent surge following their announcement about the upcoming Phoenix Mall of Asia in Bengaluru. The real estate company revealed plans for this new mall, spanning an impressive 12 lakh square feet, hosting over 440 brands, and boasting a substantial 250,000 square foot entertainment zone. This development was confirmed through a stock exchange filing made by the company on October 27.
- Karnataka Bank experienced a notable surge of over 6 percent in its stock value following the announcement of a successful fundraising initiative. The bank raised Rs 800 crore by allotting shares on a preferential basis to five institutional investors, namely HDFC Life Insurance Company, Bajaj Allianz Life Insurance Company, Quant Mutual Fund, Bharti AXA Life Insurance Company, and Bajaj Allianz General Insurance Company. The allotment of 3,34,00,132 equity shares was approved by the bank’s board, as disclosed in an exchange filing.
|
News from the IPO world🌐
- Ola Electric raises Rs. 3200 crore from investors as it gears for IPO
- Half a dozen companies expected to go public in Diwali
- Mamaearth IPO: Honasa Consumer sets price band at Rs. 308-324 a share
|
|
Day Leader Board
Nifty 50 Top Gainers | Stock | Change (%) | | COALINDIA | ▲ 3.1 | | HCLTECH | ▲ 2.9 | | AXISBANK | ▲ 2.9 | | SBIN | ▲ 2.7 | | BAJAJ-AUTO |
▲ 2.6 |
| Nifty 50 Top Losers | Stock | Change (%) | | UPL | ▼ -0.4 | | ITC | ▼ -0.1 | | HINDALCO | ▼ -0.1 | | BPCL |
▼ 0.0 | | DRREDDY |
▼ 0.0 |
| |
Sectoral Performance | Top Sectors | Day change (%) | | NIFTY PSU BANK | 4.11 | | NIFTY MEDIA | 2.58 | | NIFTY REALTY | 1.95 | | NIFTY AUTO | 1.35 | | NIFTY OIL & GAS | 1.28 |
|
Advance Decline Ratio | Advance/Declines | Day change (%) | | Advances | 2801 | | Declines | 866 | | Unchanged | 132 |
|
Numbers to track | Indices Name | Latest | % 1D | % YTD | | Dow Jones (US) | 32,784 | (0.8) % | (1.1) % | | 10 Year Gsec India | 7.4 | -0.10% | 0.40% | | WTI Crude (USD/bbl) | 83 | (0.6) % | 8.2 % | | Gold (INR/10g) | 60,652 | 0.00% | 10.70% | | USD/INR | 83.12 | 0.1 % | 0.5 % |
|
|
Please visit www.fisdom.com for a standard disclaimer.
|
