Daily Snippets
Date: 26th October 2023 |
|
|
Technical Overview – Nifty 50 |
|
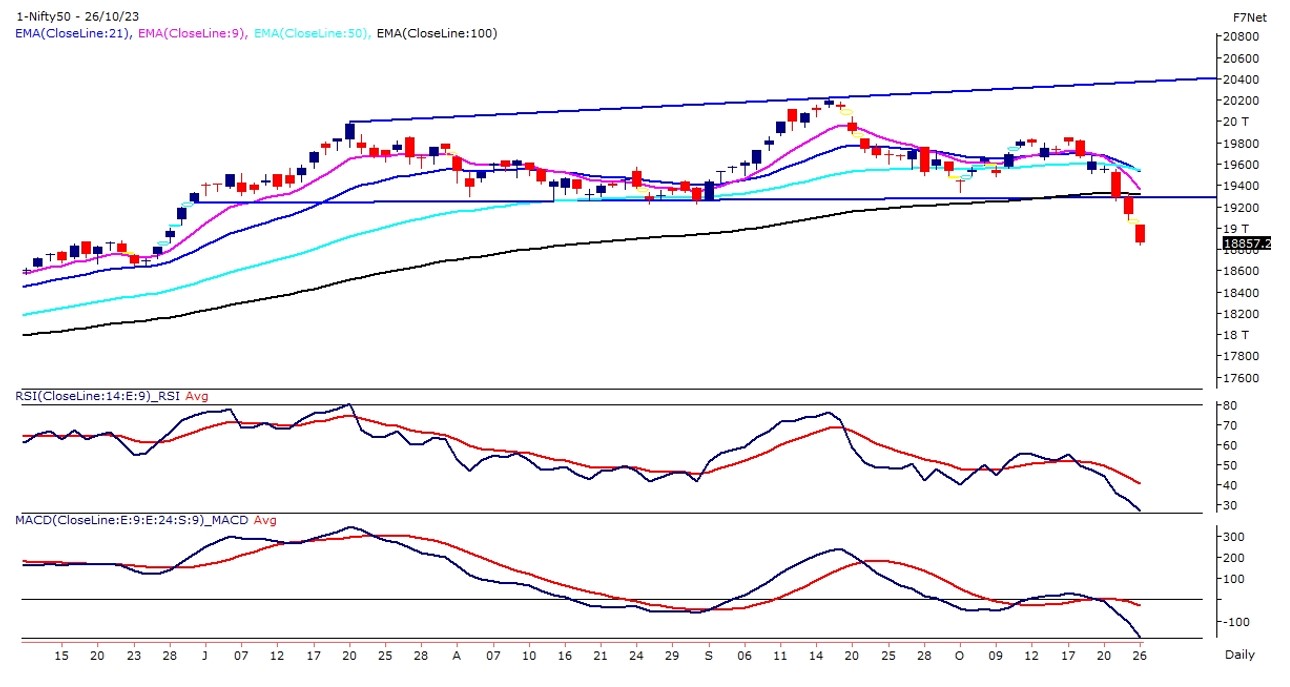
The bears continue to attack the Indian benchmark index for the third straight day and the prices drift below their important psychological support of 19,000 levels. The Nifty50 on the daily chart has formed a three-black crow candle stick pattern which indicates the sellers are on the driving seat.
The cynic FIIs at the moment are obsessed with the negativity surrounding Dalal Street on the backdrop of inflation and recession concerns. The Prices on the daily chart witnessed a head & shoulder pattern breakdown and the index is sustaining below the neckline of the pattern.
The Foreign institution investor is continuously witnessing a selling approach and that is visible in their numbers. The index has also closed below its 100 EMA on the daily chart, earlier the prices closed below its 100 DMA in the 1st week of April 2023.
The cynic FIIs at the moment are obsessed with the negativity surrounding Dalal Street on the backdrop of inflation and recession concerns. The confirmation of short-term strength is only above Nifty’s biggest hurdles at the 19,100 mark. Nifty’s biggest support is placed at the 18,700 mark.
|
Technical Overview – Bank Nifty |
|
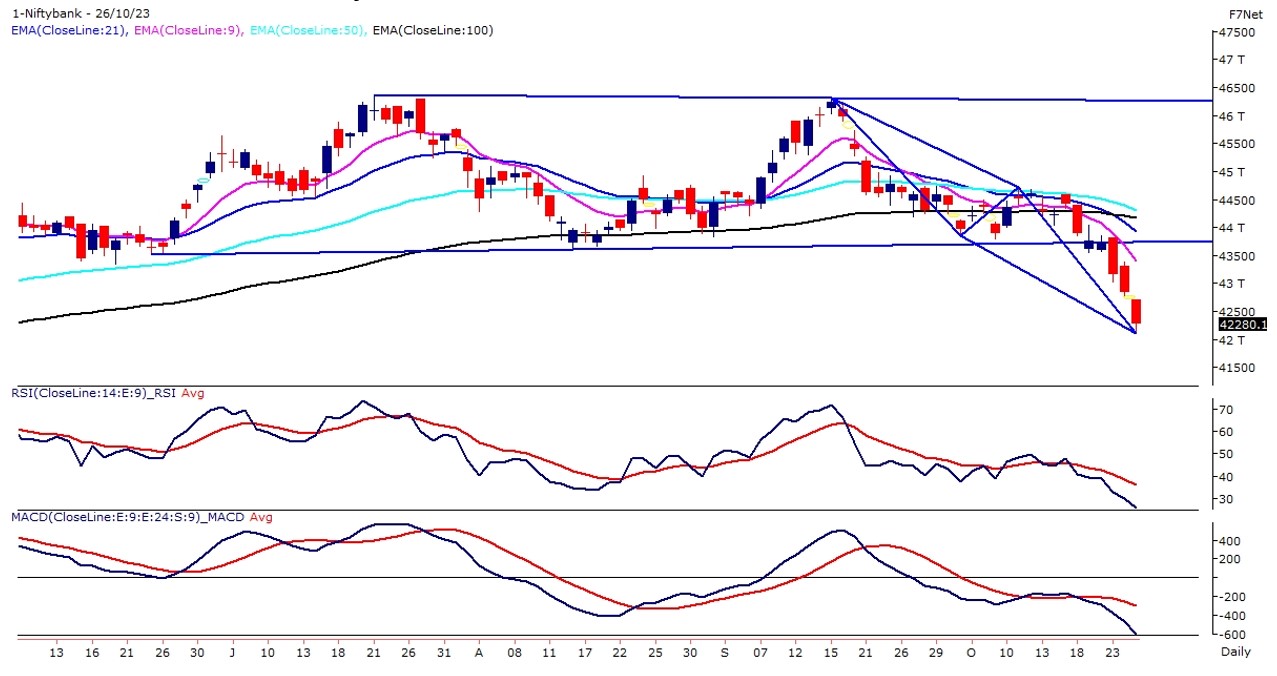
If today’s drubbing at Dalal Street is any indication, then Bank Nifty is likely to witness another uninspiring session in Friday’s trade. The Banking Index on the daily chart has formed a three-black crow candle stick pattern which indicates the sellers are in the driving seat.
After a brutal selling, the Banking Index has formed a bullish ABCD Harmonic pattern at 42,100 levels on the daily time frame and prices are trading near their PRZ levels. On the weekly chart, the Banking Index is trading in a rising wedge pattern and prices are trading near the lower band of the pattern.
A long bear candle was formed on the daily charts which could prove to be a resistance in the next move. Risk-off sentiments seem to be prevalent based on the adverse advance-decline ratio. The confirmation of the immediate strength is only above Bank Nifty’s biggest hurdles at the 43,000 mark. Bank Nifty’s biggest support is placed at the 42,000 mark.
|
Indian markets:
- The stock market experienced its sixth consecutive day of decline.
- Decline was driven by increasing US bond yields, indicating higher borrowing costs and impacting investor sentiment.
- Escalating tensions between Hamas and Israel contributed to market uncertainty.
- Most indices saw declines exceeding 1%. Slight recovery in the smallcap index was overshadowed by a subsequent drop before closing lower.
- Indian companies reported weak earnings, adding to market concerns.
- Heightened volatility due to the expiry of monthly futures and options contracts further destabilized the market.
- All sectoral indices on the NSE finished in negative territory.
- Stocks in the automobile, metal, and financial services sectors faced downward pressure.
|
Global Markets
- The Dow Jones index futures were down 171 points, indicating a weak opening in the US stocks.
- Markets in Europe declined while Asian stocks traded mostly lower on Thursday as U.S. shares slumped following a batch of poor corporate earnings.
- US stocks dropped on Wednesday as Alphabet shares slid after the Google parent posted disappointing earnings and as US Treasury yields rose, reviving fears that interest rates could stay higher for longer. Traders also kept an eye on the latest comments by US President Joe Biden after he had asked Israel to delay its invasion so that more hostages held by Hamas could be freed.
|
Stocks in Spotlight
- Asian Paints, India’s largest paint manufacturer, saw its stock decline by 3.6 percent. This drop followed the company’s announcement of lower-than-expected earnings for the September quarter of the current financial year. Despite a substantial 53 percent year-on-year increase in net profit to Rs 1,232.39 crore, the company experienced only a marginal rise in revenue. The dip in both profit and revenue was attributed to muted sales during the period, leading to a market reaction with the stock closing lower.
- Adani Group shares faced downward pressure after reports emerged that one of its auditors, SR Batliboi, affiliated with EY, was under scrutiny by India’s accounting regulator, the National Financial Reporting Authority (NFRA). The NFRA had requested files and communications from SR Batliboi, which audits five prominent Adani Group companies, including Adani Power, Adani Green Energy, Adani Wilmar, as well as cement giants Ambuja Cements and ACC. This development led to market concerns, causing a decline in Adani Group shares.
- Pharmaceutical giant Cipla announced that the United States Food and Drug Administration (USFDA) conducted a routine inspection of manufacturing facilities Unit 1 and 2 of its wholly-owned subsidiary, InvaGen Pharmaceuticals Inc, situated in Hauppauge, Long Island, New York, USA. The inspection, conducted under current Good Manufacturing Practices (cGMP), concluded with a positive outcome – zero Form 483 observations were issued. This development underscores Cipla’s adherence to quality standards. Additionally, Cipla has been in the spotlight due to speculation about the promoter Hamied family considering the sale of its stake in the company.
|
News from the IPO world🌐
- Ola Electric raises Rs. 3200 crore from investors as it gears for IPO
- Half a dozen companies expected to go public in Diwali
- Mamaearth IPO: Honasa Consumer sets price band at Rs. 308-324 a share
|
|
Day Leader Board
Nifty 50 Top Gainers | Stock | Change (%) | | AXISBANK | ▲ 1.9 | | ADANIPORTS | ▲ 0.3 | | HCLTECH | ▲ 0.2 | | POWERGRID | ▲ 0.2 |
| Nifty 50 Top Losers | Stock | Change (%) | | M&M | ▼ -3.9 | | BAJFINANCE | ▼ -3.7 | | ASIANPAINT | ▼ -3.6 | | UPL | ▼ -3.4 | | NESTLEIND | ▼ -3.4 |
| |
Sectoral Performance | Top Sectors | Day change (%) | | NIFTY FMCG | -0.54 | | NIFTY PSU BANK | -0.96 | | NIFTY IT | -1 | | NIFTY PHARMA | -1.02 | | NIFTY CONSUMER DURABLES | -1.07 |
|
Advance Decline Ratio | Advance/Declines | Day change (%) | | Advances | 1330 | | Declines | 2335 | | Unchanged | 135 |
|
Numbers to track | Indices Name | Latest | % 1D | % YTD | | Dow Jones (US) | 33,036 | (0.3) % | (0.3) % | | 10 Year Gsec India | 7.4 | 0.30% | 0.50% | | WTI Crude (USD/bbl) | 84 | (4.9) % | 8.9 % | | Gold (INR/10g) | 60,645 | 0.70% | 10.70% | | USD/INR | 83.03 | (0.2) % | 0.4 % |
|
|
Please visit www.fisdom.com for a standard disclaimer.
|


