Daily Snippets
Date: 19th October 2023 |
|
|
Technical Overview – Nifty 50 |
 |
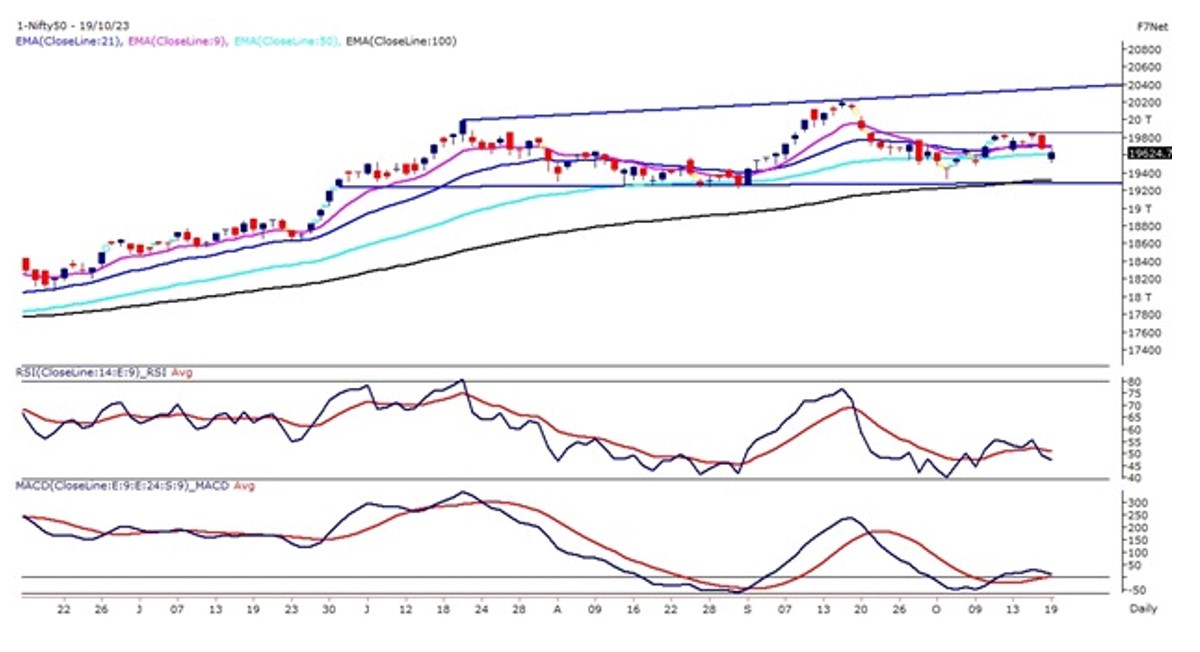
The Nifty50 on the 19th of October, witnessed a sharp gap down opening of more than 100 points following the global peers. The index registered an intraday low in the initial minutes witnessed a sharp short covering thereafter and managed to sustain above 19,600 levels throughout the day.
The index on the daily chart opened below its 50 EMA but due to a sharp spike managed to close just above the same. The prices are still trading below their 9 & 21 EMA which is acting as an overhead resistance for the index. The momentum oscillator RSI (14) has faced a strong resistance near 55 levels and hooked down thereafter.
The Benchmark index from the last 20 trading sessions is trading within the very narrow range of 300 points from 19,500 – 19,800 levels and hovering within its short and medium-term average ranges. The major trend for the index is expected only if the index breaks on either side of the range.
|
Technical Overview – Bank Nifty |
|
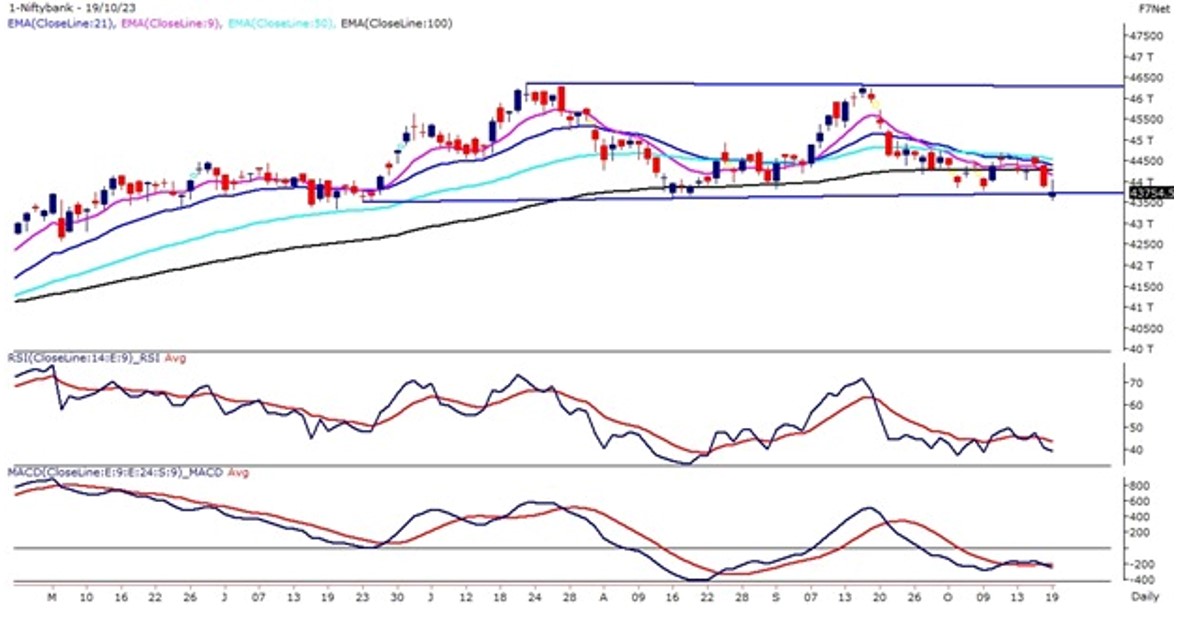
The Bank Nifty on 19 October, witnessed a gap down opening below 43,700 levels and registered an intraday low at 43,558 in the initial minutes of the trade. The volatility was always holding the upper hand during the trade and succeeded in creating an uncomfortable trading situation for the traders.
The Bank Nifty on the daily chart has been trading in a rectangle pattern for the last couple of months and is trading within the range of almost 2000 points. On Thursday trade prices breached the lower band of the pattern during the opening and continue to hover within the pivot levels.
The Banking index presently is trading below its 9, 21, 50 & 100 DEMA, which is a bearish sign for the index. The momentum oscillator RSI (14) has faced a strong resistance near 50 levels and hooked down thereafter.
The prices remain in the bearish tone as every time the index moves above its short-term averages faces an instant selling pressure. Immediate support is placed at 43,500, in case prices breach and sustain below the same bearish breakdown will be initiated in the index towards 43,000 levels. The upper band is capped below 44,200 levels near its 9 DEMA
|
Indian markets:
- Domestic stock market faced a decline on Thursday. Weak global cues and ongoing earnings season impacted the market sentiment.
- Equity indices started the day with a gap-down. Market mostly continued on a downward trajectory during the session.
- Some buying activity in the second half led to a partial recovery from earlier lows. Investor sentiment was dampened by declines in Asian and European indices.
- Escalating tensions in the Middle East contributed to the cautious approach. Many investors reduced exposure to equities, fearing a prolonged conflict.
- Auto stocks advanced during the session. Metal and energy sectors experienced selling pressure.
- Mid and small-cap stocks outperformed their larger counterparts in the market.
|
Global Markets
- Markets in Europe and Asia tumbled on Thursday, influenced by the performance of U.S. markets. The Bank of Korea decided to maintain its interest rates at 3.5% for the sixth consecutive time. The bank noted that inflation in South Korea is expected to continue slowing down, but there is uncertainty regarding future inflation trends.
- U.S. stocks ended lower Wednesday due to rising Treasury yields and investor assessment of corporate results and forecasts. Additionally, growing tensions in the Middle East contributed to risk aversion among investors. The ongoing Israel-Hamas conflict has raised concerns among market participants. During a visit to Israel, U.S. President Joe Biden expressed solidarity with Israel and suggested that a rocket misfire by militants might have caused a deadly blast at a Gaza hospital.
- U.S. Treasury yields surged to multiyear highs, with the 10-year Treasury yield exceeding 4.9% for the first time since 2007. The Federal Reserves Beige Book report indicated that the U.S. economy has shown minimal change over the past six weeks. Spending was described as mixed, while prices increased at a modest pace. Companies expect inflation to continue rising, albeit at a slower rate.
|
Stocks in Spotlight
- ICICI Lombard General Insurance shares gained on October 19, a day after the private sector insurer reported moderation in the combined ratio during the September quarter of the current financial year. The combined ratio stood at 103.9 percent against 105.1 percent in the year-ago period. The combined ratio is the sum of incurred losses and operating expenses measured as a percentage of earned premiums. A lower combined ratio means the company is doing better financially.
- Bajaj Auto stock jumped more than 6 percent after the automobile major beat analyst estimates with a 20 percent increase in net profit for the second quarter. Brokerage firms, however, were unimpressed as several concerns still linger for the automobile major such as muted exports and competition in the electric vehicles space.
- Hindustan Unilever Ltd (HUL) on October 19 reported a standalone net profit of Rs 2,717 crore for the September quarter, up 3.86 percent from the year-ago period. India’s largest FMCG company’s revenue rose 3.53 percent to Rs 15,027 crore from a year ago, the company said in an exchange filing. Net profit exceeded estimates, while net revenue was slight lower than projected. A Moneycontrol poll of four brokerages had pegged HUL’s Q2 revenue at Rs 15,300 crore and net profit at Rs 2,540.9 crore.
|
News from the IPO world🌐
- Blue Jet Healthcare sets IPO price band at Rs. 329-346, aims to raise Rs. 840 crore
- Astrotalk Aims for Rs. 600 crore revenue in FY24, sets sight on IPO
- WomanCart IPO sees 60.94 times subscription till final day of bidding
|
|
Day Leader Board
Nifty 50 Top Gainers | Stock | Change (%) | | BAJAJ-AUTO | ▲ 6.6 | | LTIM | ▲ 6 | | HEROMOTOCO | ▲ 3.7 | | NESTLEIND | ▲ 3.5 | | ULTRACEMCO | ▲ 2.9 |
| Nifty 50 Top Losers | Stock | Change (%) | | WIPRO | ▼ -3 | | TECHM | ▼ -1.5 | | SUNPHARMA | ▼ -1.5 | | NTPC | ▼ -1.2 | | UPL | ▼ -1.2 |
| |
Sectoral Performance | Top Sectors | Day change (%) | | NIFTY AUTO | 0.5 | | NIFTY CONSUMER DURABLES | 0.2 | | NIFTY FMCG | 0.14 | | NIFTY MEDIA | 0.14 | | NIFTY PSU BANK | 0.03 |
|
Advance Decline Ratio | Advance/Declines | Day change (%) | | Advances | 1806 | | Declines | 1896 | | Unchanged | 130 |
|
Numbers to track | Indices Name | Latest | % 1D | % YTD | | Dow Jones (US) | 33,665 | (1.0) % | 1.6 % | | 10 Year Gsec India | 7.4 | 0.20% | 0.20% | | WTI Crude (USD/bbl) | 88 | 1.9 % | 14.8 % | | Gold (INR/10g) | 58,922 | 0.10% | 6.70% | | USD/INR | 83.23 | 0.0 % | 0.7 % |
|
|
Please visit www.fisdom.com for a standard disclaimer.
|


