Daily Snippets
Date: 11th October 2023 |
|
|
Technical Overview – Nifty 50 |
|
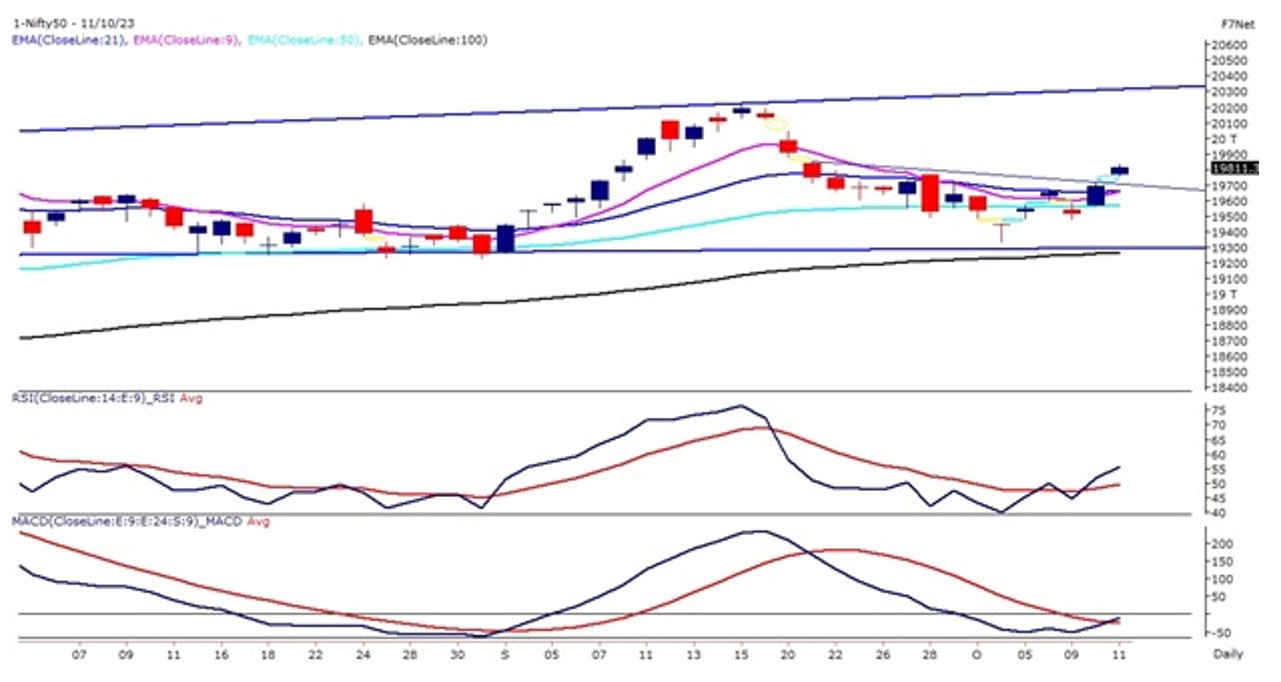
Nifty50 continued its bullish momentum for the second straight day and moved above 19,800 levels. The Benchmark index on the daily chart has witnessed an inverted head & shoulder pattern breakout and the index has closed above its neckline.
The index has shown a sustainable reversal from the lower levels after forming a bullish dragonfly Doji candle stick pattern on the daily time frame.
The benchmark index on the daily chart has formed a tall bullish candle and has closed above its 9, 21 & 50-day exponential moving average which is positive for the index. The momentum oscillator RSI (14) has given an inverted head & shoulder pattern breakout on the daily chart and the oscillator has just closed above the pattern’s neckline.
The positive takeaway from today’s trade was that Nifty recouped all of its last 2-days losses and most importantly, ended higher as bulls joined the conga line of rising global cues. Buy-on dips will be the preferred strategy for the index with immediate support at 19,650 – 19,600 levels. A sustained move above 19,850 levels will initiate a higher level of 20,000 levels.
|
Technical Overview – Bank Nifty |
|
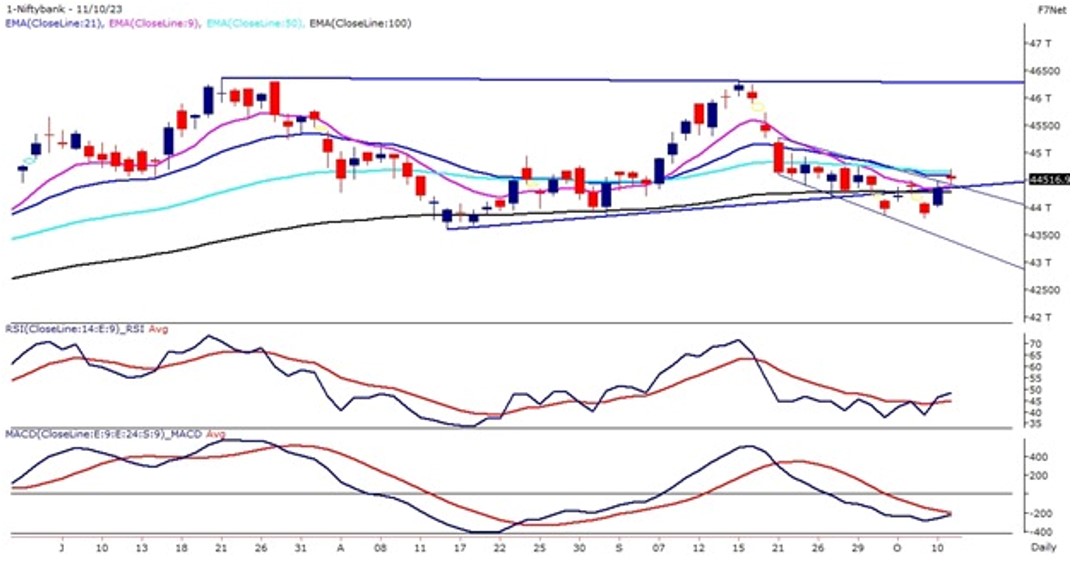
Bank Nifty advanced on Oct 11 after holding on to steady gains through the day aided by positive global cues. The Banking index opened near 44,700 levels but the index faced resistance near its 21 & 50 EMA and drifted lower 44,500 levels towards the closing.
The Banking index on the daily chart has witnessed a falling channel pattern breakout on the daily chart and on the broader time frame prices are trading within the triangle pattern. The momentum oscillator RSI (14) has given a consolidation breakout on the daily chart and the oscillator has just closed above the pattern’s neckline which is close to 50 levels.
The positive takeaway from today’s trade was that Banking Index recouped all of its last 2-days losses and most importantly, ended higher as bulls joined the conga line of rising global cues. Technically speaking, Bank Nifty’s biggest hurdle for Thursday’s trading session is seen at the 44,800 mark. On the downside, the biggest support is seen at the 44,200 – 44,100 mark.
|
Indian markets:
- The equity market sustained its winning momentum for the second consecutive day on Wednesday.
- Positive cues from global markets and strength in heavyweight stocks contributed to the market’s upward movement.
- Buying was supported by moderating US bond yields and stable crude oil prices, providing confidence to investors.
- The Nifty 50 index opened with a gap up and maintained its position throughout the day, closing approximately 121 points higher.
- Auto and FMCG shares experienced high demand, indicating investor interest in these sectors. In contrast, PSU banks and IT shares lagged behind, possibly due to lower investor confidence or specific market factors.
|
Global Markets
- The Dow Jones index futures were up 117 points, indicating a positive opening in the US stocks today.
- Markets in Europe and Asia advanced on Wednesday mirroring moves on Wall Street as U.S. Treasury yields fell and oil prices slightly eased.
- Sentiment was boosted by two Federal Reserve officials who suggested Monday that the recent rise in Treasury yields may reduce the need to raise the Federal Funds rate, paring back peak rate expectations.
- Atlanta Federal Reserve Bank President Raphael Bostic on Tuesday said rates did not need to rise any further.
- Meanwhile, the world continues to monitor the latest developments in the war between Israel and Hamas.
- US stocks climbed on Tuesday as investors awaited key inflation data out of the worlds largest economy, with the producer price index and consumer price index readings for September out Wednesday and Thursday, respectively.
|
Stocks in Spotlight
- Paytm’s shares extended their upward climb, reaching a new 52-week high. This surge was fueled by the optimistic projections from brokerages regarding One97 Communications, the company behind Paytm. Investor confidence remained high due to the overall bullish trend in the stock market, further boosting Paytm’s share prices.
- Tata Consultancy Services (TCS) announced a share buyback program worth Rs 17,000 crore, priced at Rs 4,150 per share, representing a 15 percent premium to the current market price. The buyback encompasses 4,09,63,855 shares, equivalent to 1.12 percent of the total equity. Notably, this marks TCS’s fifth share buyback in the past six years, bringing the total shares bought back to Rs 66,000 crore in four previous exercises. The stated buyback size excludes transaction costs, taxes, and other related expenses.
- TVS Motor Company’s shares surged by 2 percent following a bullish prediction by DAM Capital Advisors, stating that the stock is expected to surpass Rs 3,000 within the next 12 months. DAM Capital raised the target price significantly to Rs 3,051, indicating a remarkable upside of 62 percent from the previous target of Rs 1,875. The domestic brokerage firm reiterated its ‘buy’ recommendation for the automobile major. The revised target price includes Rs 2,826 from the core business and Rs 225 contributed by subsidiaries, reflecting the positive outlook for the company’s overall performance.
|
News from the IPO world🌐
- 28 IPOs worth Rs. 38,000 crore to hit the street in second half
- Manappuram Finance arm Asirvad Micro Finance files for Rs. 1500 crore IPO
- IRM Energy IPO to open on October 18th
|
|
Day Leader Board
Nifty 50 Top Gainers | Stock | Change (%) | | HEROMOTOCO | ▲ 4 | | GRASIM | ▲ 3.3 | | WIPRO | ▲ 3.3 | | ULTRACEMCO | ▲ 2.1 | | RELIANCE | ▲ 1.6 |
| Nifty 50 Top Losers | Stock | Change (%) | | HCLTECH | ▼ -1.7 | | COALINDIA | ▼ -0.6 | | LTIM | ▼ -0.6 | | SBIN | ▼ -0.5 | | TCS | ▼ -0.4 |
| |
Sectoral Performance | Top Sectors | Day change (%) | | NIFTY AUTO | 0.92 | | NIFTY FMCG | 0.87 | | NIFTY MEDIA | 0.86 | | NIFTY REALTY | 0.84 | | NIFTY OIL & GAS | 0.73 |
|
Advance Decline Ratio | Advance/Declines | Day change (%) | | Advances | 2320 | | Declines | 1379 | | Unchanged | 123 |
|
Numbers to track | Indices Name | Latest | % 1D | % YTD | | Dow Jones (US) | 33,739 | 0.4 % | 1.8 % | | 10 Year Gsec India | 7.3 | -0.60% | -0.30% | | WTI Crude (USD/bbl) | 86 | (0.5) % | 11.8 % | | Gold (INR/10g) | 57,364 | 0.20% | 4.70% | | USD/INR | 83.25 | (0.2) % | 0.7 % |
|
|
Please visit www.fisdom.com for a standard disclaimer.
|
