Daily Snippets
Date: 06th October 2023 |
|
|
Technical Overview – Nifty 50 |
|
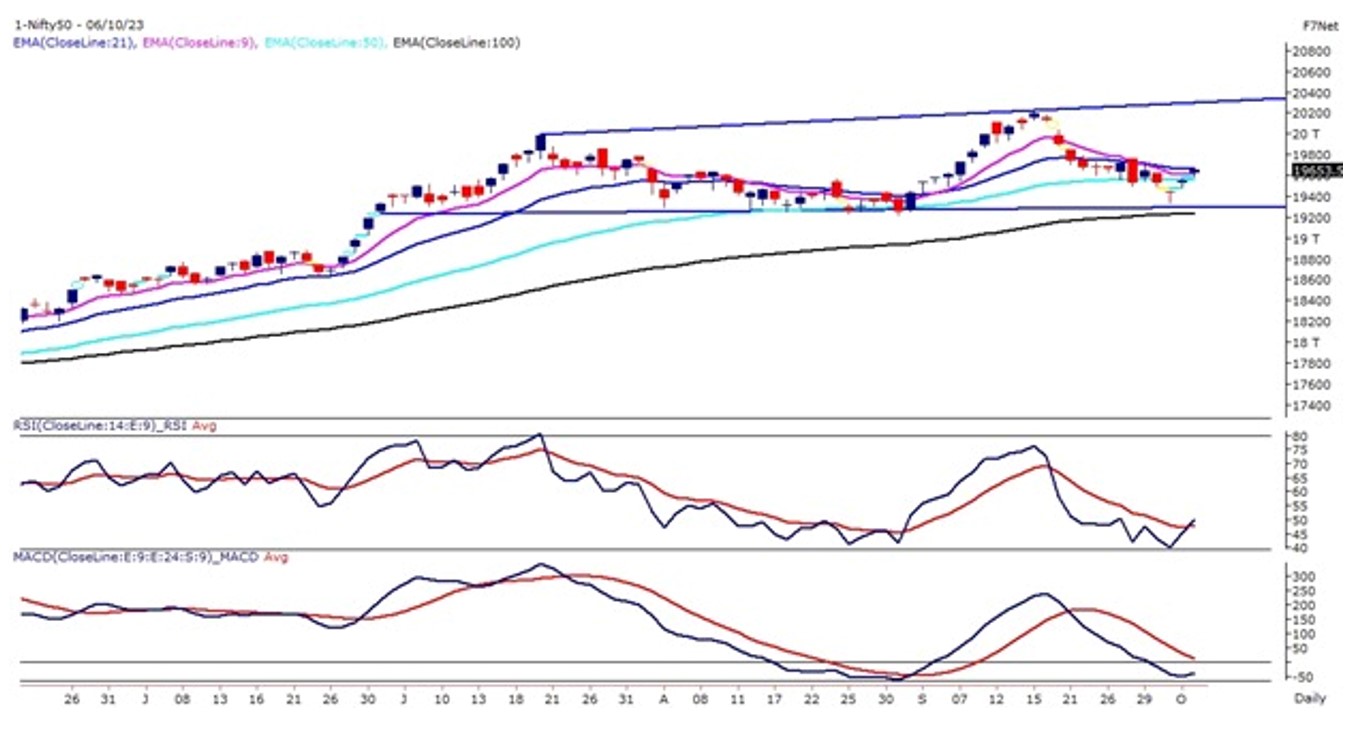
On the last trading day of the week, the Nifty50 witnessed a gap up opening above 19,600 levels and sustained above the same and post RBI Monetary policy announcement prices continued to trade higher and formed a bullish candle on the daily chart.
On the weekly chart, prices have formed a dragonfly Doji candle stick pattern near its 21 EMA which is placed at 19,250 levels. The Dragonfly Doji is considered a bullish reversal pattern and a closing above the candle in the coming weeks will be considered a bullish confirmation for the pattern.
On the daily chart, the index has taken support near the lower band of the broadening triangle pattern and prices have moved higher post that. The momentum oscillator RSI (14) has hooked up after forming an immediate bottom at 40 levels.
The buy-dips strategy is best at present levels with immediate support placed at 19,550 levels and the resistance is capped at 19,800 levels.
|
Technical Overview – Bank Nifty |
|
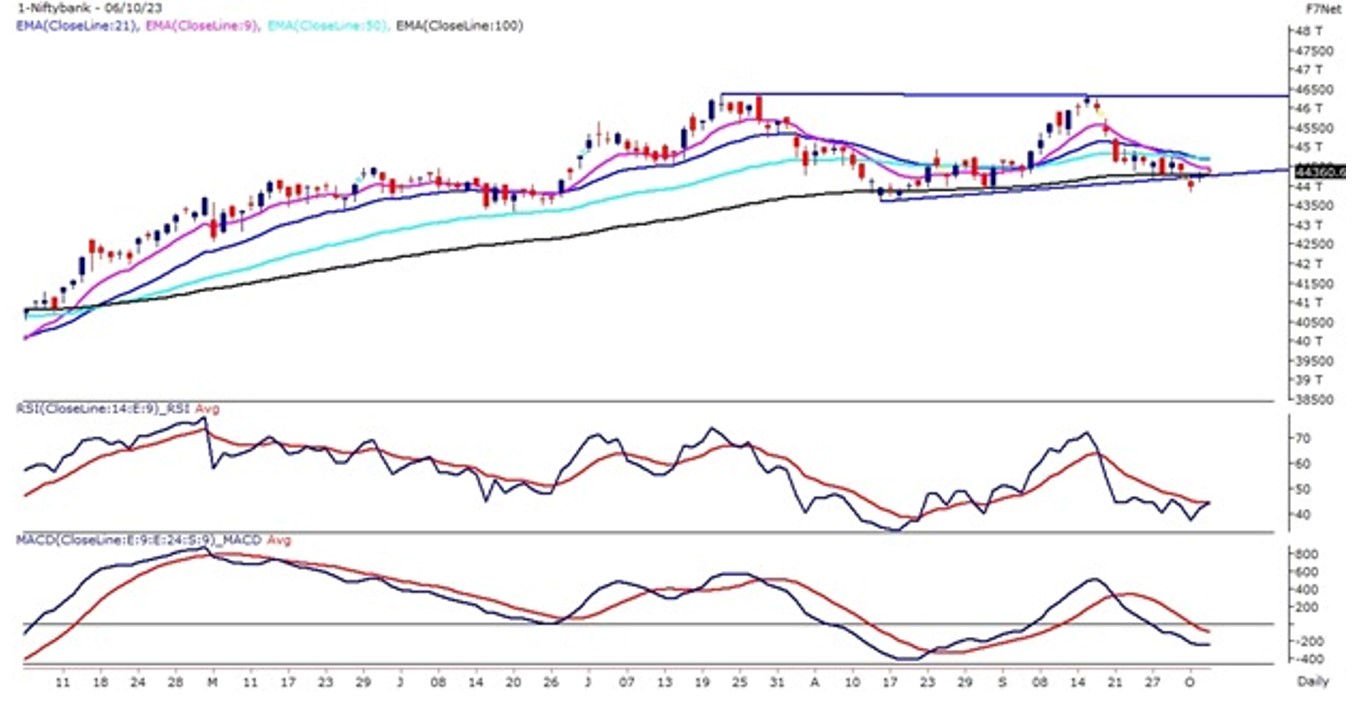
On the last trading day of the week, the Bank Nifty witnessed a gap up opening above 44,300 levels and traded with super volatility yet succeeded to close in the green. The Bank Nifty on the daily chart has closed above its 100-day exponential moving average but still trading below its 9 & 21 EMA.
The Bank Nifty on the weekly chart has formed a hammer pattern near its 21 EMA but closed with a half-a percent loss. The index is trading within the rising wedge pattern and is presently sustained near the middle of the pattern.
The momentum oscillator RSI (14) has formed a double bottom pattern near 40 levels and presently hovering near the same. The Baking index has formed a spinning top candle stick pattern just below the overhead resistance of 9 EMA which is placed at 44,450 levels.
The index has completed its pullback near its trend line resistance which is placed near 44,300 levels. The immediate support for the index is placed at 43,850 and the upside is capped at 44,800 levels.
|
Indian markets:
- The domestic stock market responded positively to the RBI’s decision of keeping interest rates unchanged for the fourth consecutive time.
- The Nifty surpassed the 19,650 mark, and the Sensex approached 66,100 intraday, showcasing significant gains.
- On the daily charts, the Nifty closed above the 40-day moving average, indicating a bullish trend and positive market sentiment.
- Realty and consumer durables sectors were the top performers, leading the market surge. In contrast, PSU banks and oil & gas shares experienced relatively subdued performance and took a backseat during the trading session
|
Global Markets
- Markets in Europe and Asia advanced on Friday, as investors look ahead to U.S. jobs data that could set the tone for the Federal Reserves next move for interest rates. Chinas markets remain closed for the weeklong holiday.
- US stocks ended lower Thursday as investors looked toward key jobs data on Friday that could determine the next move for interest rates. Weekly initial jobless claims came in at 207,000 for the week ending September 30, up just 2,000 from the prior weeks numbers.
|
Stocks in Spotlight
- Indigo’s stock surged by over 2 percent following the company’s announcement of implementing a fuel charge on both domestic and international routes starting October 6. The move was made to counter the impact of escalating aviation turbine fuel (ATF) prices, which have witnessed consistent hikes over the last three months. India’s largest airline revealed this decision in a statement released on October 5, indicating the company’s proactive approach to managing increased operational costs..
- Nykaa experienced a nearly 2 percent rise in its stock value following a strong performance in the September quarter across all its verticals, including Nykaa Fashion. This notable achievement stands out amidst a backdrop of subdued discretionary consumption in the industry, which was partly due to a delayed festive season. Nykaa’s robust performance reflects the company’s resilience and effective strategies in navigating challenging market conditions, showcasing its ability to thrive even in adverse circumstances..
- Kalyan Jewellers witnessed a significant surge of over 10 percent in its stock value following its announcement of a remarkable 32 percent year-on-year growth in revenue from domestic operations during the July-September quarter. Simultaneously, the company reported a substantial 27 percent growth in consolidated revenue, encompassing both domestic and Middle East operations. This robust performance underscores the company’s strong market presence and effective business strategies, contributing to its impressive financial results.
|
News from the IPO world🌐
- IPO fundraising slumps by 26% in H1 FY24 to Rs. 26,300 crore
- Manappuram Finance arm Asirvad Micro Finance files for Rs. 1500 crore IPO
- Fincare Small Finance Bank IPO gets SEBI approval
|
|
Day Leader Board
Nifty 50 Top Gainers | Stock | Change (%) | | BAJAJFINSV | ▲ 5.6 | | BAJFINANCE | ▲ 3.8 | | TITAN | ▲ 2.8 | | INDUSINDBK | ▲ 2.2 | | TATACONSUM | ▲ 1.7 |
| Nifty 50 Top Losers | Stock | Change (%) | | HINDUNILVR | ▼ -0.8 | | COALINDIA | ▼ -0.6 | | ONGC | ▼ -0.4 | | ASIANPAINT | ▼ -0.3 | | BHARTIARTL | ▼ -0.3 |
| |
Sectoral Performance | Top Sectors | Day change (%) | | NIFTY REALTY | 3.08 | | NIFTY CONSUMER DURABLES | 0.77 | | NIFTY FINANCIAL SERVICES | 0.71 | | NIFTY PHARMA | 0.71 | | NIFTY IT | 0.67 |
|
Advance Decline Ratio | Advance/Declines | Day change (%) | | Advances | 2298 | | Declines | 1365 | | Unchanged | 138 |
|
Numbers to track | Indices Name | Latest | % 1D | % YTD | | Dow Jones (US) | 33,120 | (0.0) % | (0.1) % | | 10 Year Gsec India | 7.3 | 1.70% | 0.20% | | WTI Crude (USD/bbl) | 84 | (5.6) % | 9.5 % | | Gold (INR/10g) | 56,630 | 0.20% | 3.10% | | USD/INR | 83.27 | 0.1 % | 0.7 % |
|
|
Please visit www.fisdom.com for a standard disclaimer.
|


