Daily Snippets
Date: 03rd October 2023 |
|
|
Technical Overview – Nifty 50 |
|
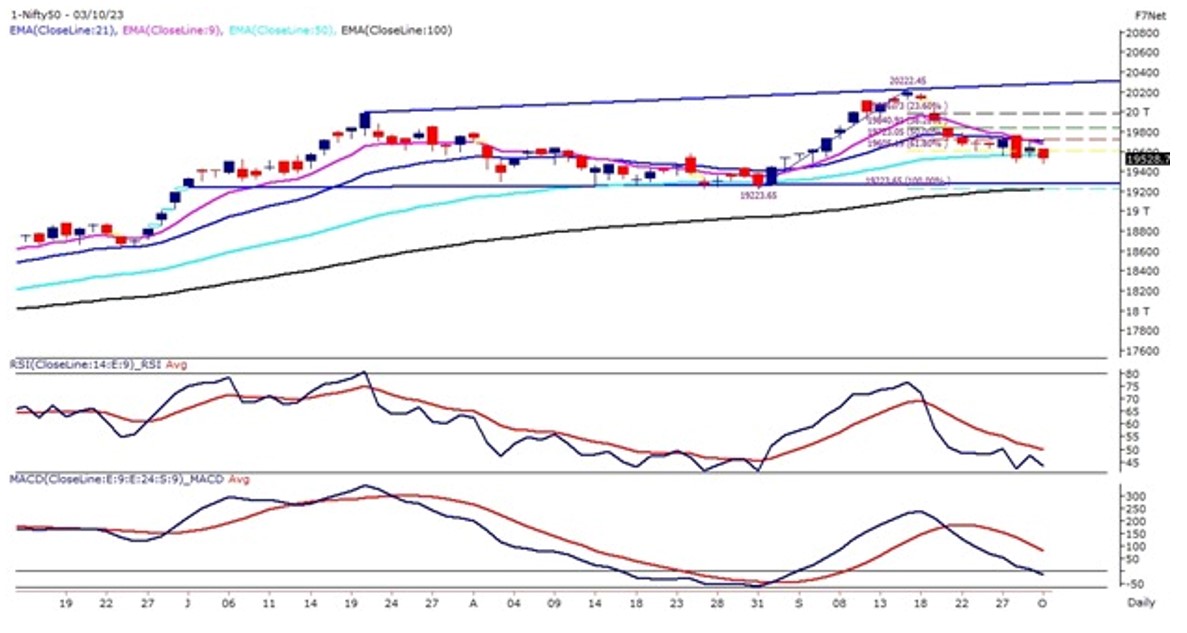
The Benchmark after an extended weekend opened with a sharp cut below 19,600 levels recorded an intraday low at 19,479 levels and traded with a bearish bias throughout the day. Due to the short recovery towards the end prices moved above 19,500 levels but closed half a percent down.
On the weekly time frame, Nifty formed a “Doji” candlestick pattern and on the intraday time frame index is trading in a falling channel pattern. The momentum oscillator RSI (14) has sloped lower and hovered near 45 – 45 levels with sluggish movement.
The Nifty on the daily chart is trading in a broadening pattern and presently has drifted lower below the 61.80% Fibonacci retracement which is placed at 19,605 levels. The immediate support for the benchmark index is placed at 19,400 – 19,350 levels and the upper band is capped below 19,750 levels.
|
Technical Overview – Bank Nifty |
|
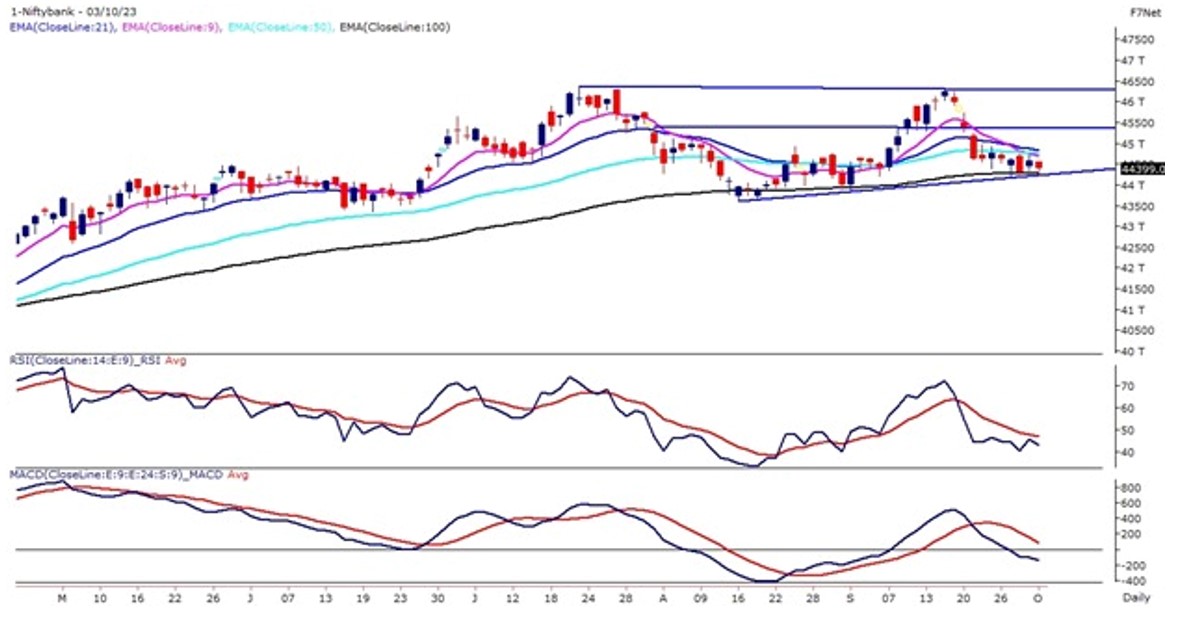
The Bank Nifty after an extended weekend opened with a sharp cut below 44,500 levels recorded an intraday low at 44,243 levels and traded with a bearish bias throughout the day. Due to the short recovery towards the end prices moved above 44,350 levels but closed 0.40 percent down.
On the weekly time frame, the Banking Index formed a “Doji” candlestick pattern and on the intraday time frame index is trading in a triangle pattern. The momentum oscillator RSI (14) has sloped lower and hovered near 45 – 45 levels with sluggish movement.
The Bank Nifty on the daily chart is trading in a rectangle pattern and prices have taken support near the lower band of the pattern. A bearish dead cross has been witnessed in the banking index where 9 EMA has crossed below 21 EMA indicating a bearish sign for the index.
The view remains bearish to sideways and the immediate support for the index is placed at 44,200 – 44,000 levels. A close below the said levels will be a bearish breakdown in the banking index. And an immediate resistance is placed at 44,700 – 44,850 levels.
|
Indian markets:
- Domestic equity benchmarks closed lower on Tuesday, driven by weak global cues, leading to widespread selling.
- The day started cautiously at 19,622, mirroring mixed trends in Asian markets.
- Although there were attempts at recovery, higher levels were short-lived, and Nifty 50 closed below 19,550.
- PSU banks and media sectors performed well, but energy and auto shares lagged behind.
- Mid and smallcap indices outperformed the frontline index, with corrective moves primarily observed in heavyweight stocks.
- Investors reduced equity exposure ahead of the monetary policy committee meeting scheduled from October 4th-6th, indicating cautious sentiment.
- Despite robust September GST collections, global concerns continued to impact the local market trend, leaving investors unenthused.
|
Global Markets
- Markets in Europe declined while Asian stocks ended mixed on Tuesday. Investors were cautious after top Federal Reserve officials expressed their willingness to raise interest rates if economic data suggests a slow approach towards the 2% inflation target. While inflation remains elevated, these officials stressed the need for a restrictive monetary policy over an extended period to achieve their objectives.
- Japans yen slid to near a one-year low, putting traders on watch for intervention from Japanese authorities. Chinese markets were closed for the week because of the Golden Week Holiday.
- The World Bank forecasts growth in the developing East Asia and Pacific region to remain strong at 5% in 2023. However, its expects growth to ease in the second half of 2023 and fall to 4.5% in 2024, according to its regional update published on Sunday.
|
Stocks in Spotlight
- UltraTech Cement experienced marginal growth in its shares despite a significant 16 percent increase in consolidated sales volume. The company disclosed in a regulatory filing on October 2 that its sales volumes for the July-September quarter stood at 26.69 million tonnes, with domestic market sales, including grey and white cement, rising by 15 percent year-on-year to 25.66 million tonnes. Despite this robust performance, the company’s shares saw only slight gains, even with an ‘overweight’ rating from Morgan Stanley.
- NCC, backed by Rekha Jhunjhunwala, experienced a 4 percent surge following the announcement of three substantial orders totaling Rs 4,205.94 crore. These orders, received from state and Union government agencies, encompass various divisions, including water, electrical, and transport. Notably, the transport order, valued at Rs 6,301.08 crore and issued by Mumbai’s BMC to the joint venture between J Kumar and NCC, highlighted NCC’s significant role with a 51 percent share in the partnership. This positive development led to the boost in NCC’s stock value.
- Metro Brands, backed by late-Rekha Jhunjhunwala, surged by 12 percent, reaching a new 52-week high at Rs 1,293. The significant increase was attributed to a positive report from Prabhudas Lilladher, issued on September 28, recommending an ‘Accumulate’ call for the company. Metro Brands’ strategic acquisitions, including renowned brands like Crocs, FILA, and Fitflop, were cited as factors contributing to its substantial growth potential, indicating a promising trajectory for the company.
|
News from the IPO world🌐
- Waaree Group aims to raise Rs. 2000 crore IPO
- JSW Infra IPO debuts in style lists at 20% premium
- Fincare Small Finance Bank IPO gets SEBI approval
|
|
Day Leader Board
Nifty 50 Top Gainers | Stock | Change (%) | | BAJFINANCE | ▲ 2 | | LT | ▲ 1.7 | | TITAN | ▲ 1.3 | | BAJAJFINSV | ▲ 1.3 | | ADANIPORTS | ▲ 0.8 |
| Nifty 50 Top Losers | Stock | Change (%) | | ONGC | ▼ -3.8 | | EICHERMOT | ▼ -2.7 | | MARUTI | ▼ -2.7 | | HINDALCO | ▼ -2.5 | | DRREDDY | ▼ -2.3 |
| |
Sectoral Performance | Top Sectors | Day change (%) | | NIFTY PSU BANK | 2.38 | | NIFTY MEDIA | 1 | | NIFTY CONSUMER DURABLES | 0.63 | | NIFTY REALTY | 0.46 | | NIFTY IT | -0.21 |
|
Advance Decline Ratio | Advance/Declines | Day change (%) | | Advances | 1872 | | Declines | 1905 | | Unchanged | 179 |
|
Numbers to track | Indices Name | Latest | % 1D | % YTD | | Dow Jones (US) | 33,433 | (0.2) % | 0.9 % | | 10 Year Gsec India | 7.2 | 0.40% | -0.70% | | WTI Crude (USD/bbl) | 81 | (11.0) % | 5.1 % | | Gold (INR/10g) | 57,061 | -0.20% | 4.40% | | USD/INR | 83.14 | (0.1) % | 0.6 % |
|
|
Please visit www.fisdom.com for a standard disclaimer.
|

