Daily Snippets
Date: 22nd September 2023 |
|
|
Technical Overview – Nifty 50 |
|
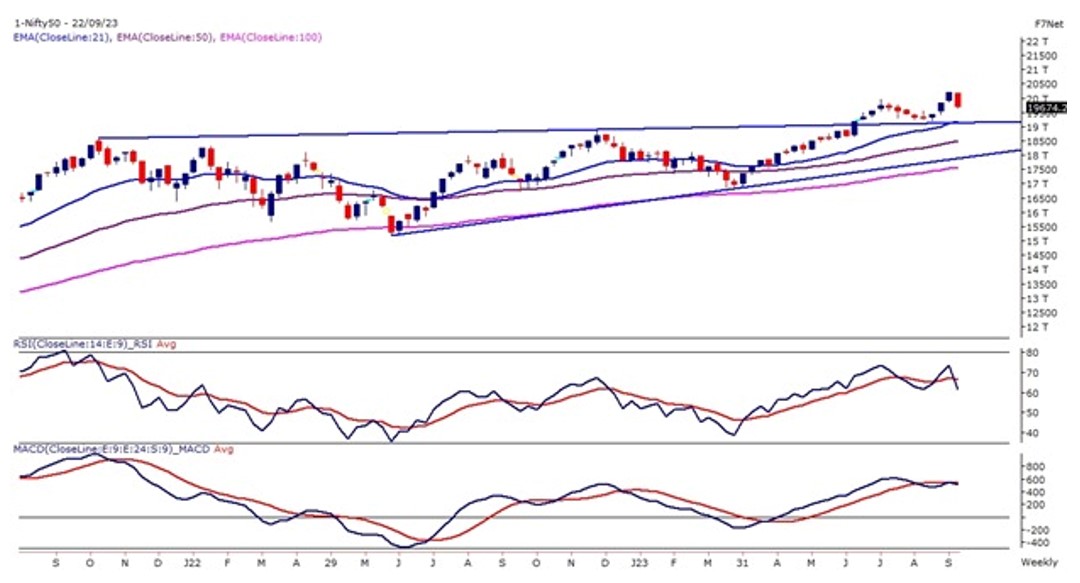
The Nifty index closed below the 20-day EMA (exponential moving average – 19,780), signaling a diminishing bullish sentiment. The selling pressure continues after the back-to-back gap-down moves, with the Nifty50 falling in a lower high lower low formation.
The Benchmark index on the weekly chart has formed a tall red candle after three consecutive weeks of positive closing. The Index has drifted more than 2.50% in a week indicating a strong throwback towards 19,650 levels. The prices on the daily chart are trading in a broadening triangle pattern and presently have taken resistance at the top and drifted lower.
The momentum indicator RSI has come down from the overbought zone in the daily chart, at the same time it has been reading above 60 levels in weekly and monthly charts. The MACD indicator has witnessed a bearish crossover above its line of polarity signifies an early reversal warning in the benchmark index.
The immediate support is near 19,600 on the downside, a break below 19,600 will trigger further downside till 19,500 levels. Upside a break above 19,850 would add some bullishness.
|
Technical Overview – Bank Nifty |
|
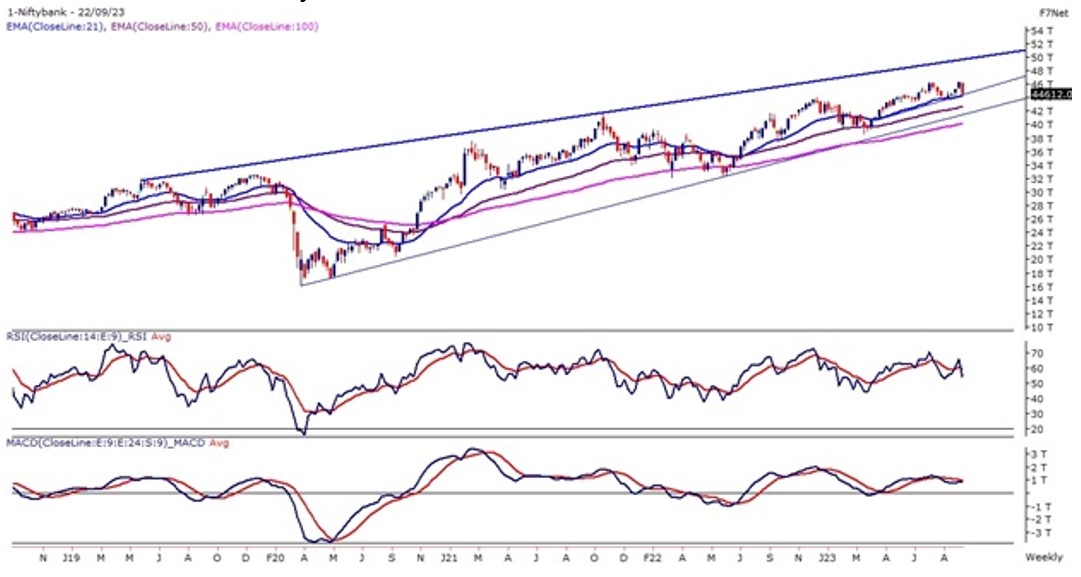
The Bank Nifty on 22nd Sept witnessed a gap-up opening but prices could hold on to the gains and continue to trade with a supper volatile and prices were swinging like a pendulum. The Banking index on the weekly chart has drifted more than 3.45% and has formed a tall red candle indicating selling pressure.
The Banking index closed in red for all four days in a week and prices drift below its 9 & 21 EMA on the daily time frame. The momentum oscillator RSI has come down from the overbought zone in the daily chart and drifted 50 levels with a bearish crossover on the cards. The Index has formed a double top formation on the daily chart and prices have closed below the pivot point of the pattern.
The broader markets also continued to correct further, with the Nifty Midcap 100 and Small Cap 100 indices declining 1.69 percent and 2.48 percent respectively, with breadth in favor of bears in the 1:2 ratio. The immediate support is near 44,200 on the downside, a break below 44,200 will trigger further downside till 44,000 levels. Upside a break above 45,200 would add some bullishness.
|
Indian markets:
- Domestic equity benchmarks suffered a third consecutive day of losses on Thursday.
- The Nifty index closed below the key support level of 19,750.
- Market trading was marked by significant volatility, driven by the expiry of weekly index options on the NSE.
- The US Federal Reserve maintained its policy stance but issued a cautionary statement signaling that elevated interest rates would persist for an extended period.
- Investors grew apprehensive due to the hawkish tone of the Fed chair, expectations of prolonged high interest rates, and concerns about a slowing global economy.
- Negative factors such as foreign fund outflows, a strengthening US Dollar, rising treasury yields, and elevated crude oil prices contributed to the bearish sentiment.
- Mid and small-cap stocks saw substantial declines, while PSU banks and auto sector shares faced significant sell-offs.
- In contrast, media and IT sector shares displayed relative strength amid the overall weak market conditions.
|
Global Markets
- Asian markets traded lower on Friday following overnight losses on Wall Street amid dampened risk appetite.
- Japan’s Nikkei 225 declined 1.15% ahead of the Bank of Japan’s decision, while the Topix fell 0.92%. South Korea’s Kospi dropped 0.87% and the Kosdaq eased 0.7%.
- Hong Kong’s Hang Seng index futures traded lower at 17,585 compared to the HSI’s close of 17,655.41.
- Australia’s S&P/ASX 200 slid 1.4%.
- The US stock market indices ended sharply lower on Thursday amid worries that interest rates will remain higher for longer, while the benchmark 10-year US Treasury yields touched a 16-year peak.
|
Stocks in Spotlight
- Glenmark Pharma stock declined over 3 percent after the pharma company agreed to sell 75 percent of its stake in subsidiary Glenmark Life Sciences to Nirma. According to a regulatory filing, Glenmark Pharmaceuticals entered into a definitive agreement with Nirma to divest a 75 percent stake in Glenmark Life Sciences for Rs 5,651.5 crore at a price of Rs 615 a share. After the sale, Glenmark Pharma will own 7.84 percent in Glenmark Life Sciences.
- Maruti Suzuki gained over 2 percent after Citi and Morgan Stanley reiterated their bullish stance on the company. “Maruti’s business is turning around on expected lines. The sport utility vehicle (SUV) market share gains and volume recovery are now more vivid. Earnings before interest, tax, depreciation and amortisation (Ebitda) margin could rise to 11 percent in the July-September quarter of fiscal year 2023-24 (Q2FY24) from 10 percent in Q1FY24
- Berger Paints slumped over 11 percent after turning ex-bonus. In the past month, the paint and coating manufacturer has surged 12 percent. Earlier this month, the company fixed September 23 as the record date to ascertain the eligibility of shareholders for the issue of bonus equity shares in the ratio 1:5, that is, one equity share of Re 1 for every five shares of Re 1 each
|
News from the IPO world🌐
- Ola Electric eyes IPO filing by end Oct in expedited listing plan
- RR Kabel lists at over 14% premium to IPO price
- TATA Capital may launch IPO in 2025
|
|
Day Leader Board
Nifty 50 Top Gainers | Stock | Change (%) | | INDUSINDBK | ▲ 2.90% | | MARUTI | ▲ 2.60% | | SBIN | ▲ 1.80% | | M&M | ▲ 1.70% | | ASIANPAINT | ▲ 1.10% |
| Nifty 50 Top Losers | Stock | Change (%) | | WIPRO | ▼ -2.40% | | DRREDDY | ▼ -2.30% | | UPL | ▼ -1.80% | | CIPLA | ▼ -1.70% | | BAJAJ-AUTO | ▼ -1.60% |
| |
Sectoral Performance | Top Sectors | Day change (%) | | NIFTY PSU BANK | 3.51% | | NIFTY AUTO | 0.21% | | NIFTY BANK | -0.03% | | NIFTY IT | -0.04% | | NIFTY Private Bank | -0.09% |
|
Advance Decline Ratio | Advance/Declines | Day change (%) | | Advances | 1689 | | Declines | 1953 | | Unchanged | 139 |
|
Numbers to track | Indices Name | Latest | % 1D | % YTD | | Dow Jones (US) | 34,070 | (1.1) % | 2.8 % | | 10 Year Gsec India | 7.2 | 0.40% | -1.80% | | WTI Crude (USD/bbl) | 90 | (0.0) % | 16.5 % | | Gold (INR/10g) | 58,853 | -0.90% | 7.50% | | USD/INR | 83.1 | (0.2) % | 0.5 % |
|
|
Please visit www.fisdom.com for a standard disclaimer.
|
