|
||||||||||||||||||||||||||
| ||||||||||||||||||||||||||
Technical Overview – Nifty 50 | ||||||||||||||||||||||||||
| ||||||||||||||||||||||||||
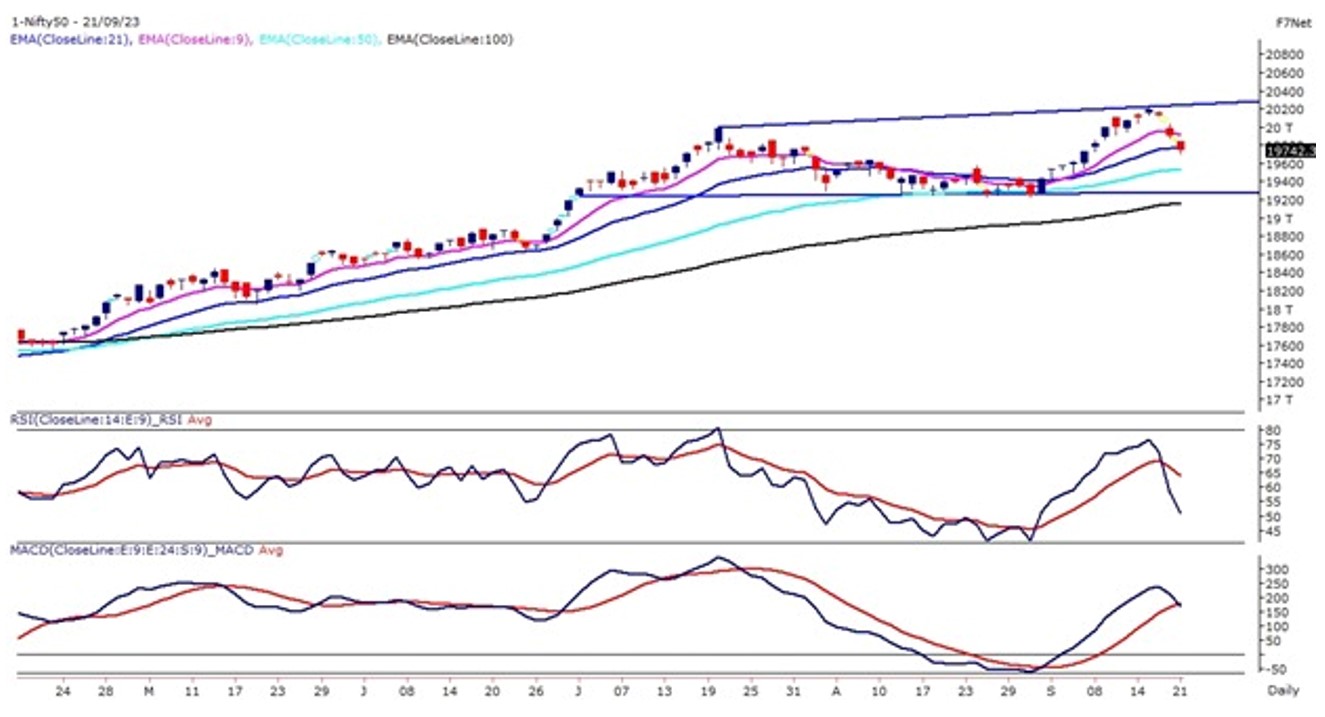
It was a sea of red at Dalal Street amidst a hawkish Fed pause. The Federal Reserve kept interest rates unchanged but left open the possibility of one more rate hike this year. The Nifty50 slipped in the red for the third straight day and fell almost 500 points from its all-time high levels. After the gap-down opening nifty traded in lower top and lower bottom formation and closed below the psychological level of 19,800 levels. The momentum indicator RSI has come down from the overbought zone in the daily chart, at the same time it has been reading above 60 levels in weekly and monthly charts. On the weekly chart, the index is already down by more than 2 percent and has formed a tall red candle suggesting a throwback setup for the index. The index has closed below its 9 & 21 EMA. The oscillator on the intraday time frame is in the oversold condition and a sharp bounce fall after a steep fall cannot be ruled out. The immediate support for the index is placed at 19,700 & 19,650 levels and resistance is capped below 19,900 levels. | ||||||||||||||||||||||||||
Technical Overview – Bank Nifty | ||||||||||||||||||||||||||
| ||||||||||||||||||||||||||
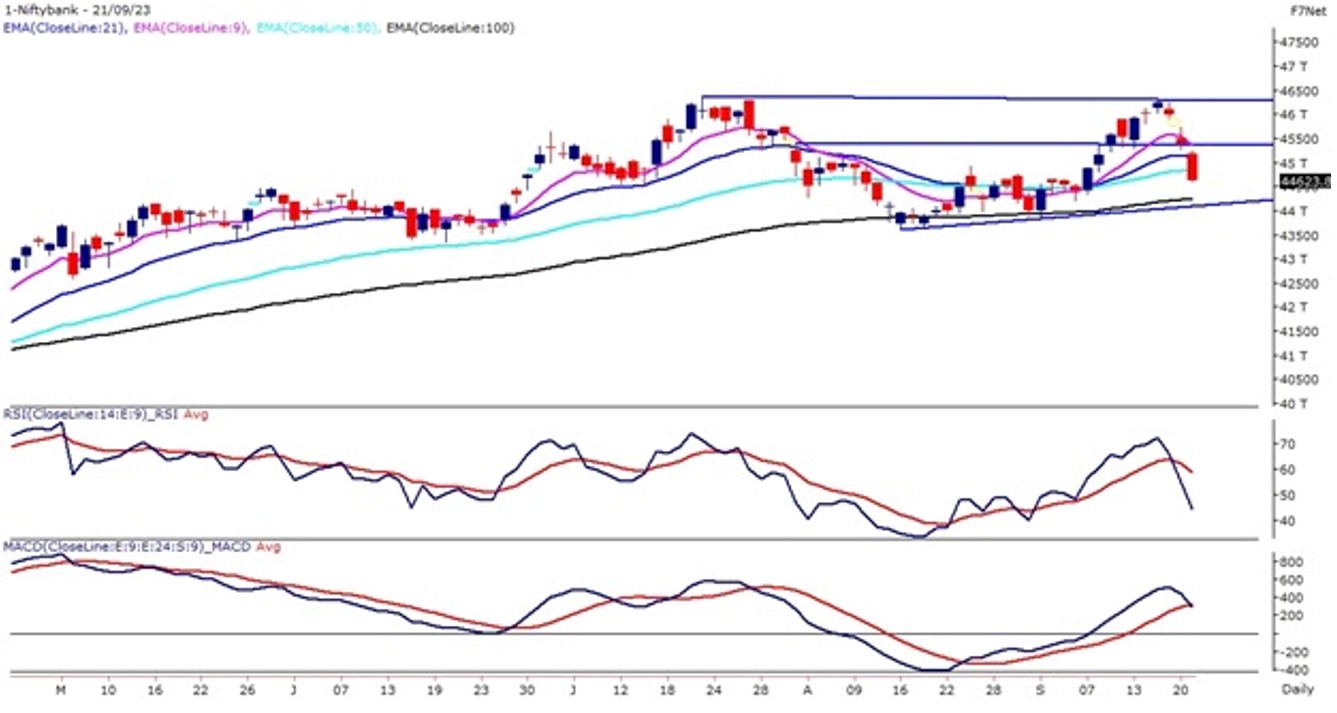
The undertone momentum continues for the Banking index as prices fall by more than 1.50% on 21st Sept and close below the 44,700 mark with a tall red candle. After the gap-down opening Bank Nifty traded in lower top and lower bottom formation and continued its bearish momentum. The momentum oscillator RSI has come down from the overbought zone in the daily chart and drifted 50 levels with a bearish crossover on the cards. The Index has formed a double top formation on the daily chart and prices have closed below the pivot point of the pattern. On the weekly chart, the index is already down by more than 3 percent and has formed a tall red candle suggesting a throwback setup of the index. The index has closed below its 9 & 21 EMA. | ||||||||||||||||||||||||||
Indian markets:
| ||||||||||||||||||||||||||
Global Markets
| ||||||||||||||||||||||||||
Stocks in Spotlight
| ||||||||||||||||||||||||||
News from the IPO world🌐
| ||||||||||||||||||||||||||
|
Day Leader Board
| ||||||||||||||||||||||||||
Sectoral Performance
| ||||||||||||||||||||||||||
Advance Decline Ratio
| ||||||||||||||||||||||||||
Numbers to track
| ||||||||||||||||||||||||||
|
Please visit www.fisdom.com for a standard disclaimer. |
