Daily Snippets
Date: 18th August 2023 |
|
|
Technical Overview – Nifty 50 |
|
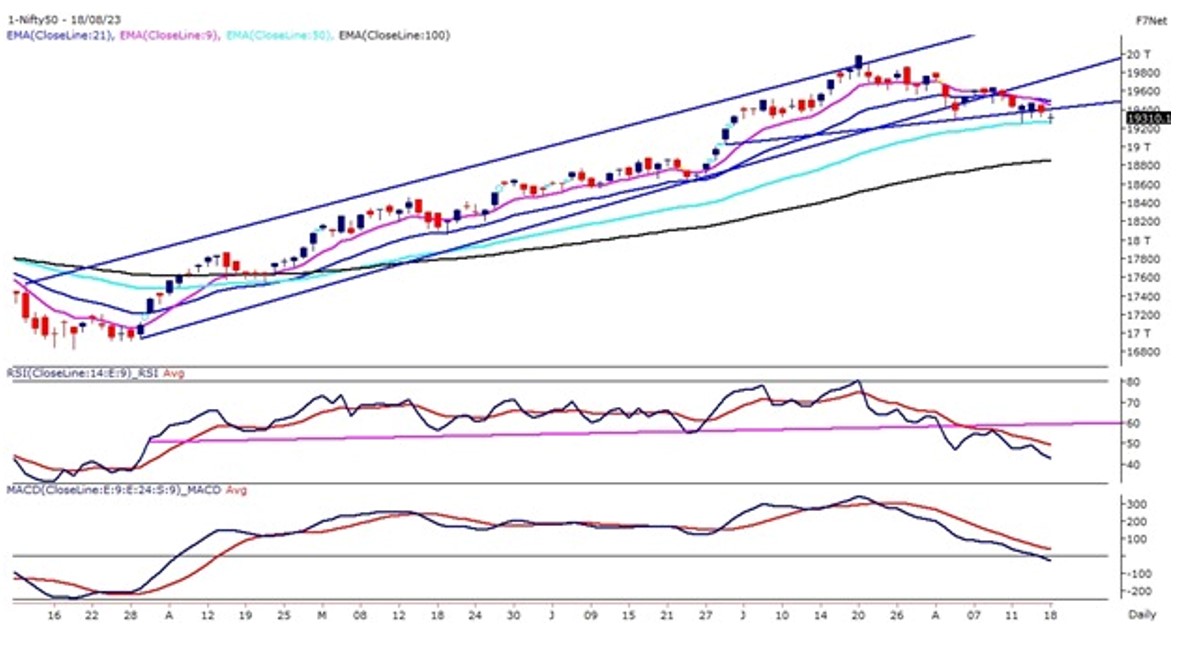
The Benchmark index is gradually drifting lower week by week and closed in the red for the fourth consecutive week on the weekly time frame. The Nifty50 on the 18th Aug witnessed a gap down opening of more than 50 points following its global peers and closed the week with a loss of 0.75 %.
The prices on the daily chart have drifted below its upward-rising trend line which was acting as an immediate support from the last three trading sessions. The index on the 240 mins chart has given a head & shoulder pattern breakdown and prices are trading below the neckline of the pattern.
The bears were aggressive enough to push prices below 19,300 levels and recorded a day low at 19253.60 levels. The India VIX on the daily chart has witnessed a falling wedge pattern breakout above 11.5 levels and presently closed at 12.26 levels with a gain upside of more than 6%. The higher VIX suggests an increase in the volatility.
The current structure looks like a lower high lower low formation is unfolding on the Nifty as per the daily timeframe chart and the market is currently indicating a short-term bearishness. Presently 19,100 looks possible on the lower end and on the flip side, a close above 19,450 levels will be the first sign of reversal for the index.
|
Technical Overview – Bank Nifty |
|
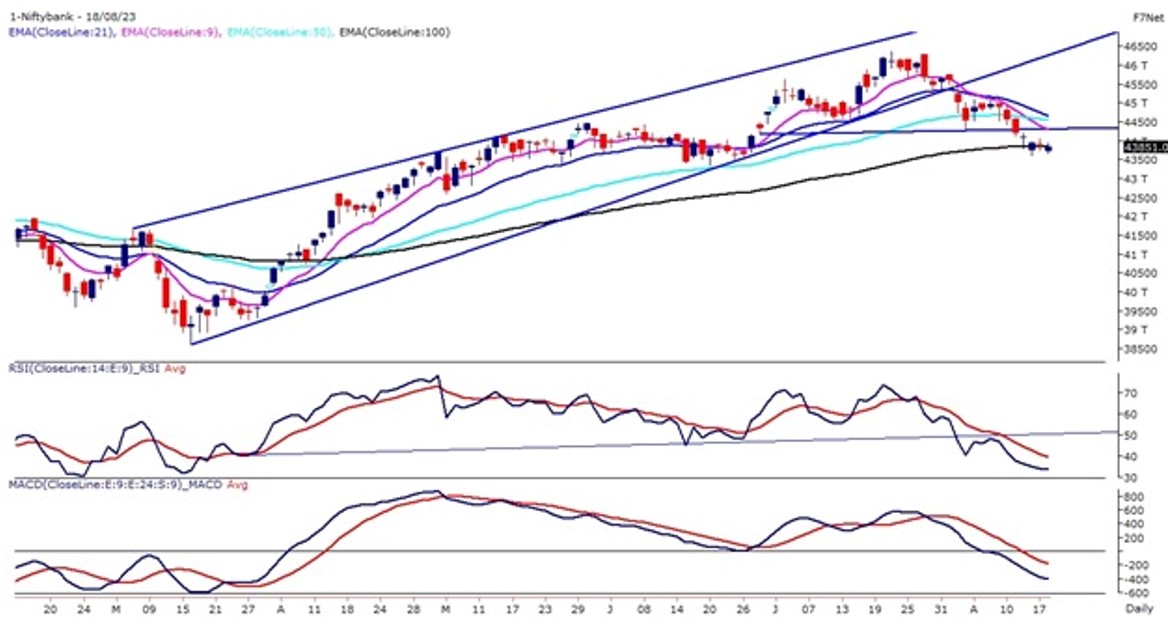
The Bank Nifty showed a promising start during the morning session, refusing to make a lower low indicating an outperformance stance against the Nifty. However, the sentiment shifted as the Banking index encountered a significant drop and closed below the 44,000 mark.
The Bank Nifty index is gradually drifting lower week by week and closed in the red for the fourth consecutive week on the weekly time frame. The index on the daily chart is hovering near its 100–day exponential moving average which is placed at 43,850 levels from the last four trading sessions.
In the latter part of the day, Bank Nifty experienced a lack of momentum but exhibited signs of recovery from its daily low. The momentum oscillator RSI (14) is moving in a lower low formation and the slope of the oscillator is tilted lower.
The trend remains bearish as long as the banking index stays below the neckline of the bearish head & shoulder pattern which is placed at 44,350 levels. A break below 43,600 would add more bearishness & it will take the banking index lower near 43,300 levels. On the flip side, hurdles for bulls are near neckline resistance which is placed at 44,200, and the 44,400 levels.
|
Indian markets:
- Domestic stock market records second successive decline; Nifty index ends slightly above 19,300 point.
- Profit-taking predominantly observed in IT and PSU stocks.
- Growing worries about inflation lead to dampened market sentiment. Investor preference shifts towards safer assets, influencing domestic equities.
- Apprehensions arise over potential US interest rate hike and global equity market downturn, negatively affecting IT stocks. Increased US bond yields contribute to heightened caution among investors.
|
Global Markets
- Markets in Europe and Asia declined on Friday as investors assessed Japans July inflation data and fresh blows to Chinas real estate sector. Japans core inflation for July fell to 3.1% from Junes figure of 3.3%, in line with expectations. The headline inflation rate for July came in at 3.3%, unchanged from Junes figure.
- Meanwhile, embattled Chinese real estate giant Evergrande has filed for bankruptcy protection in a U.S bankruptcy court on Thursday as the real estate crisis in China deepens. With debts estimated to total more than $300 billion, it was the worlds most heavily indebted property developer, as per reports.
- US stocks ended lower on Thursday as investors continued to grapple with minutes from the U.S. Federal Reserve that showed it remains concerned about inflation, and more rate hikes may be needed.
|
Stocks in Spotlight
- NLC India initially surged by over 3 percent during early trading on August 18, following its agreement with Rajasthan Urja Vikas Nigam for a long-term power usage deal. However, by the market close, the stock experienced a decline of 2 percent. The agreement entails the supply of 300 MW solar power to Rajasthan over the next quarter-century through the CPSU scheme. The project’s annual target is an impressive 750 million units of eco-friendly energy, dedicated entirely to fulfilling Rajasthan’s energy needs.
- Confidence Petroleum saw a 4 percent rise in its shares following the inauguration of 13 new auto LPG dispensing stations (ALDS) aimed at serving the green fuel needs of cars and auto rickshaws. This addition comes after the company’s introduction of 16 new ALDS in May, alongside its CNG retailing division surpassing a daily sale of 50,000 KG in Bengaluru. Notably, the company’s net profit for the June quarter exhibited an impressive 125.3 percent year-on-year surge, reaching Rs 32.02 crore, accompanied by a substantial 146.3 percent revenue increase at Rs 875.13 crore.
- Shares of Power Grid traded lower on August 17, post successful commissioning of a project in the North-East. The state-owned electric services company has successfully commissioned assets under North-Eastern Region Strengthening Scheme-VI. The company received notification for the commercial operation on August 16, according to an exchange filing.
|
News from the IPO world🌐
- Pyramid Technologies IPO subscribed 1.6 times on day 1
- Auto components maker Happy Forgings files IPO papers with Sebi
- Concord Biotech to list at 21 percent premium
|
|
Day Leader Board
Nifty 50 Top Gainers | Stock | Change (%) | | ADANIENT | ▲ 3.70% | | ADANIPORTS | ▲ 3.00% | | EICHERMOT | ▲ 1.40% | | MARUTI | ▲ 0.90% | | BRITANNIA | ▲ 0.70% |
| Nifty 50 Top Losers | Stock | Change (%) | | HEROMOTOCO | ▼ -2.20% | | TECHM | ▼ -2.00% | | TCS | ▼ -2.00% | | HINDALCO | ▼ -1.90% | | INFY | ▼ -1.70% |
| |
Sectoral Performance | Top Sectors | Day change (%) | | NIFTY MEDIA | 0.65% | | NIFTY PSU BANK | 0.23% | | NIFTY FMCG | 0.22% | | NIFTY METAL | 0.20% | | NIFTY AUTO | 0.05% |
|
Advance Decline Ratio | Advance/Declines | Day change (%) | | Advances | 1483 | | Declines | 2132 | | Unchanged | 133 |
|
Numbers to track | Indices Name | Latest | % 1D | % YTD | | Dow Jones (US) | 34,475 | (0.8) % | 4.0 % | | 10 Year Gsec India | 7.2 | -0.50% | 5.00% | | WTI Crude (USD/bbl) | 80 | 1.3 % | 4.5 % | | Gold (INR/10g) | 58,027 | -0.70% | 6.10% | | USD/INR | 83.23 | (0.1) % | 0.7 % |
|
|
Please visit www.fisdom.com for a standard disclaimer.
|

