Daily Snippets
Date: 17th August 2023 |
|
|
Technical Overview – Nifty 50 |
|
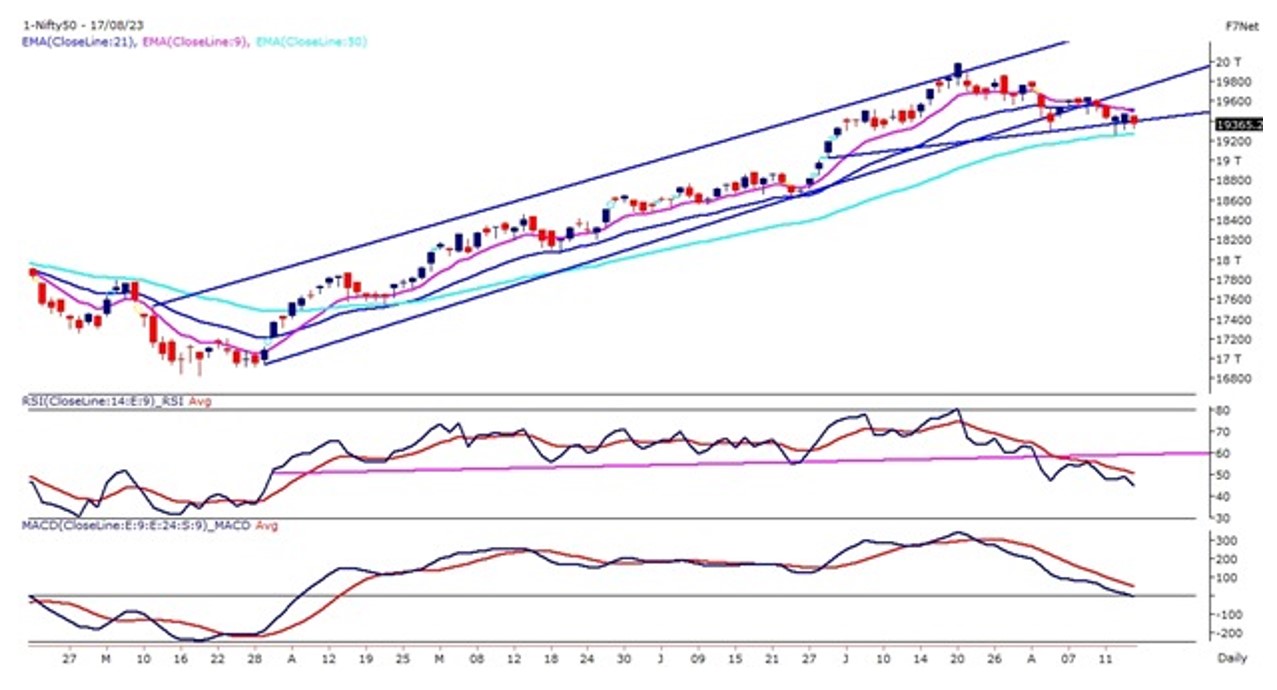
For the third consecutive day, Nifty is trading in a tangle range within the band of 21 & 50-day exponential moving average. On the weekly expiry day, the Nifty witnessed a marginal negative opening taking the clues from its global peers. The bears were aggressive enough to push prices below 19,350 levels and recorded a day low at 19326.25 levels.
The benchmark index from the past three trading days is trading above its upward-rising trend line support but the price movement indicates indecision among the traders and the range is getting narrow with an increase in the volatility. The India VIX on the daily chart has witnessed a falling wedge pattern breakout above 11.5 levels and presently reading above 12.10 levels. The higher VIX suggests an increase in the volatility.
As Nifty drifts lower, CALL Writers are booking Profits at the higher strikes & shifting lower, while forced liquidation is seen for PUT Writers. Maximum Call Open Interest Build Up witnessed in 19400-19500 Call & on the Put Side Maximum Open Interest is being witnessed in 19300-19400 levels. The PCR ratio holds at 0.84.
A close below 19,250 might pull the market down towards 19,050. On the flip side, hurdles for bulls are the 21 EMA at 19500 and the 19550 level (61.8% of the recent decline).
|
Technical Overview – Bank Nifty |
|
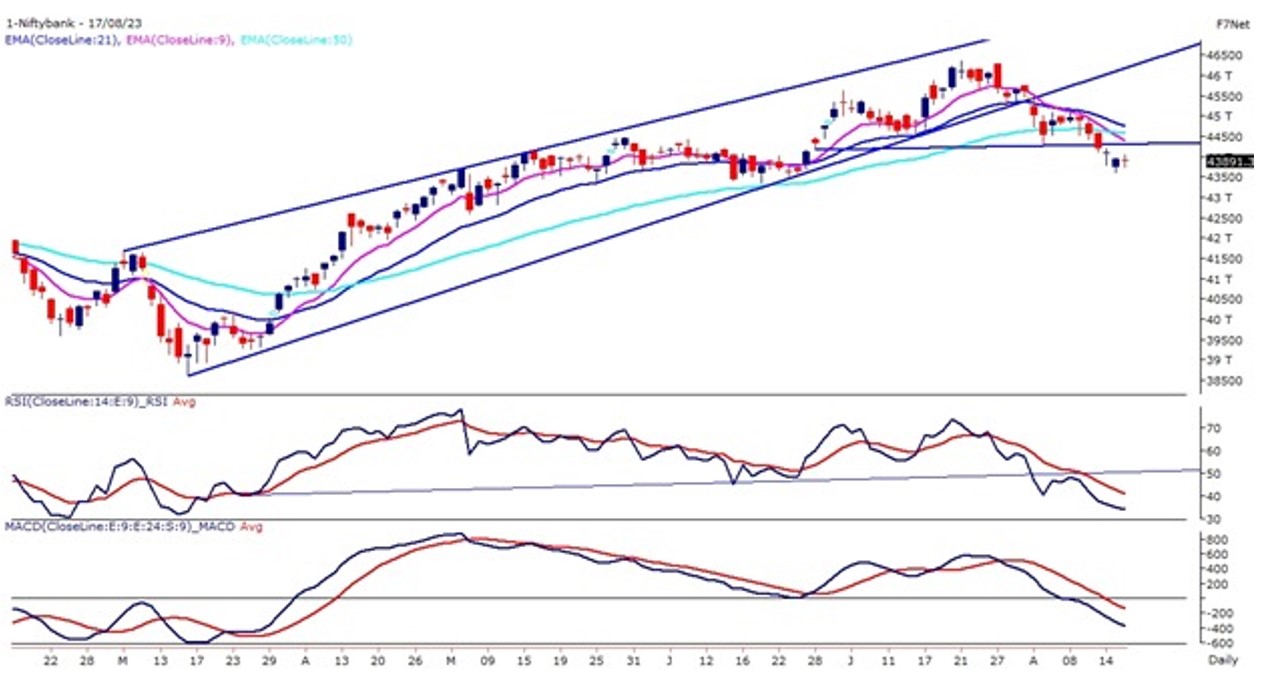
The Bank Nifty continues to trade below the neckline of the head & shoulder pattern on the daily time frame. The bearish dead cross is visible on the daily chart where 21 EMA is crossed below 50 EMA which reflects price weakness. On the daily chart, the index has formed a long-leg Doji candle stick pattern which indicates indecision among the trades.
The Bank Nifty on the weekly chart has witnessed an upward trend line breakdown but is trading marginally above the 21-week exponential moving average. The prices witnessed significant resistance at the 21–day exponential moving average which is placed at around 44,400 levels on the daily time frame. The momentum oscillator RSI (14) has drifted below 40 levels with a bearish crossover on the cards.
The trend remains bearish as long as the banking index stays below the neckline of the bearish head & shoulder pattern which is placed at 44,350 levels. A break below 43,600 would add more bearishness & it will take the banking index lower near 43,300 levels. On the flip side, hurdles for bulls are near neckline resistance which is placed at 44,200, and the 44,400 levels.
|
Indian markets:
- Frontline indices concluded the day lower, halting a two-day streak of gains.
- Market trading exhibited volatility due to the expiration of weekly index options on the NSE.
- The Nifty index ended below the 19,400 mark.
- Shares of consumer durables and PSU banks saw gains, while FMCG and oil & gas shares faced declines.
- Global cues reflected ongoing weakness in risk assets, denting investor confidence.
- The latest US Federal Reserve minutes hinted at the possibility of another interest rate hike to manage inflation amidst the current cycle of rate increases.
- China’s recent macroeconomic data revealed a more pronounced economic slowdown than previously anticipated, raising concerns about its impact on global economic growth.
|
Global Markets
- European and Asian stocks fell on Thursday, following the release of the U.S. Federal Reserves July minutes, which revealed persistent concerns about inflation.
- In related news, Chinas Premier Li Qiang stated on Wednesday that the country is committed to achieving its economic targets for the year. Li also emphasized the importance of integrating security and development efforts.
- Furthermore, U.S. stocks closed lower on Wednesday as the minutes from the recent Federal Reserve meeting indicated that central bankers believe inflation remains high enough to potentially necessitate additional interest rate hikes.
- The meeting summary stated, Given that inflation is still significantly above the Committees long-term objective and the labor market remains tight, most participants continue to perceive substantial upward risks to inflation, which may require further monetary policy tightening.
|
Stocks in Spotlight
- Rashtriya Chemicals and Fertilizers (RCF) shares jumped 4% on August 17 after it received the environmental clearance for setting up a nano-urea plant at its Trombay facility in Mumbai suburbs. In a filing with the exchanges, the state-owned fertiliser producer said it had received the green light from the Ministry of Environment, Forest and Climate Change for installing a nano-urea fertiliser production plant. The company informed that the plant would be capable of producing 27,375 kilo-litre a year. RCF reported an 18.4% on-year decline in revenue from operations at Rs 4,043 crore for the first quarter of FY24, while its profit after tax slumped 77.3% to Rs 68 crore and operating profit margins contracted 600 basis points to 3%.
- Bata India shares jumped 5.46 percent and were trading at Rs 1,737.05 at 12.49 pm on August 17 after a news report said that the shoe and leather goods maker has entered talks with Adidas for a tie-up for the Indian market. The stock is still far below its 52-week high of Rs 1,989, hit exactly a year ago on August 17, 2022. Around 15 lakh shares changed hands on the exchanges — five times more than the company’s monthly traded average. The two footwear companies — Bata India and Adidas — are in talks for a strategic partnership and are likely at an advanced stage, CNBC-TV18 reported citing unidentified sources.
- Shares of Power Grid traded lower on August 17, post successful commissioning of a project in the North-East. The state-owned electric services company has successfully commissioned assets under North-Eastern Region Strengthening Scheme-VI. The company received notification for the commercial operation on August 16, according to an exchange filing.
|
News from the IPO world🌐
- Pyramid Technologies IPO opens on Friday
- Auto components maker Happy Forgings files IPO papers with Sebi
- Concord Biotech to list on Friday.
|
|
Day Leader Board
Nifty 50 Top Gainers | Stock | Change (%) | | ADANIPORTS | ▲ 4.40% | | TITAN | ▲ 2.00% | | ADANIENT | ▲ 1.30% | | SBIN | ▲ 1.10% | | BAJAJ-AUTO | ▲ 1.10% |
| Nifty 50 Top Losers | Stock | Change (%) | | ITC | ▼ -2.10% | | LTIM | ▼ -2.10% | | POWERGRID | ▼ -1.80% | | RELIANCE | ▼ -1.60% | | LT | ▼ -1.60% |
| |
Sectoral Performance | Top Sectors | Day change (%) | | NIFTY CONSUMER DURABLES | 1.79% | | NIFTY PSU BANK | 1.43% | | NIFTY REALTY | 0.12% | | NIFTY METAL | -0.06% | | NIFTY BANK | -0.13% |
|
Advance Decline Ratio | Advance/Declines | Day change (%) | | Advances | 1784 | | Declines | 1802 | | Unchanged | 154 |
|
Numbers to track | Indices Name | Latest | % 1D | % YTD | | Dow Jones (US) | 34,766 | (0.5) % | 4.9 % | | 10 Year Gsec India | 7.2 | 0.50% | 5.50% | | WTI Crude (USD/bbl) | 79 | (2.0) % | 3.2 % | | Gold (INR/10g) | 58,302 | -0.20% | 6.80% | | USD/INR | 83.29 | 0.2 % | 0.8 % |
|
|
Please visit www.fisdom.com for a standard disclaimer.
|


