1. Jubilant FoodWorks Ltd
| Counter | JUBLFOOD 517.35 |
| Call | Buy on dip |
| Target 1 | 545 |
| Target 2 | 565 |
| Stop Loss | 480 or 460 |
| Time Horizon | 3-4 weeks |
| Notes | Buy-on-dip towards 505 & Avg around 490 |
Jubilant FoodWorks Limited is India’s largest foodservice company and is part of the Jubilant Bhartia Group. Incorporated in 1995, the Company holds the exclusive master franchise rights from Domino’s Pizza Inc. to develop and operate the Domino’s Pizza brand in India, Sri Lanka, Bangladesh and Nepal. In India, it has a strong and extensive network of 1,838 Domino’s restaurants across 394 cities.
| Previous Close | 491.3 | TTM EPS | 4.1 |
| 52 Week High | 652.4 | TTM PE | 126.8 |
| 52 Week Low | 412.1 | P/B | 23.7 |
| Sector PE | 48.4 | Mkt Cap (Rs. Cr.) | 34,123 |
(Source: Moneycontrol, BSE, Fisdom Research)
Technical Outlook

(Source: Fisdom Research)
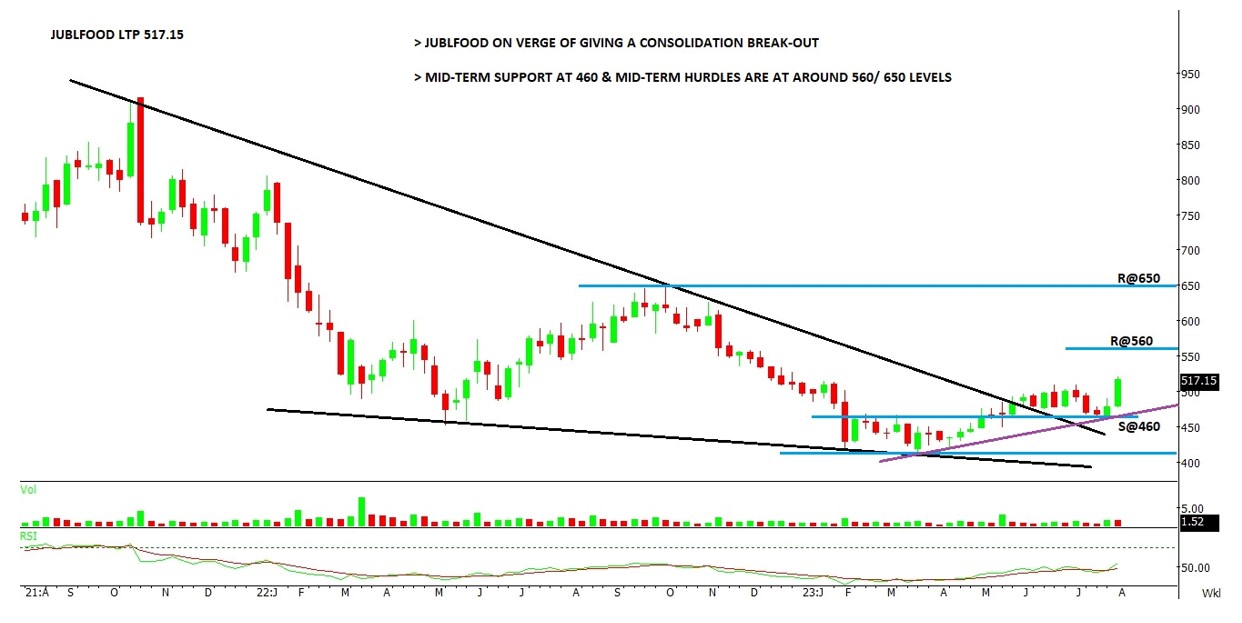
- Last week, the company Jublfood saw a positive change as it broke out from a period of stability. It finished the week at its highest point of the year.
- This break-out was backed by decent volume and resulted in the highest closing point in eight months.
- The counter has been in corrective mode from highs of 916 in Oct-2021 & formed back above 400 levels in Mar-2023.
- The company had been going through a phase of correction since reaching its highest point of 916 in October 2021. But it managed to bounce back and rise above the 400 level by March 2023.
- This week, the counter might experience a new period of growth, with a chance of moving towards the levels of 600-630.
- Looking at the price analysis, if the company’s trading remains above the range of 480-460, the immediate trend is “Range to Up”.
Open Interest Study

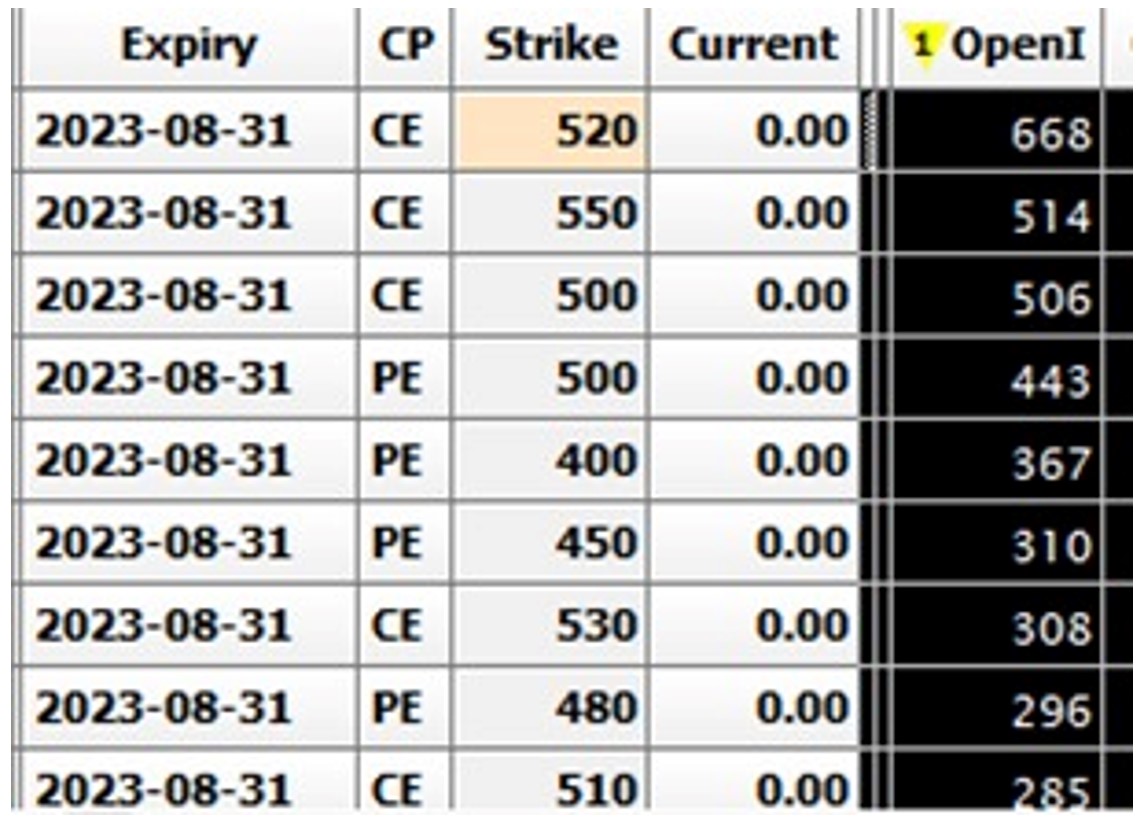
- August series OI Chain for Jublfood indicates there is a significant increase in Open Interest (OI) around the 520 strike rate. And the next resistance levels are seen around 550 strike rates
- On the lower end, the maximum build-up of Put options (PE) is happening at the 500 and 450 levels. This indicates that there is substantial support and buying interest for the stock at these levels.
F&O Strategy
| Scrip | JUBLFOOD 517.35 |
| Risk | Moderate |
| Ratio | 1:1:1 |
| Bias | Holding above 460 – “Range to up” |
| Max Reward Expected | ₹ 26,250 |
| Max Risk Expected | ₹ 11,250 |
| Action | Scrip | Lot Size | IP | LTP |
| BUY | JUBFOOD FUT | 1250 | 517.6 | 517.6 |
| BUY | JUBFOOD AUG 520 PE | 1250 | 17.55 | 17.55 |
| SELL | JUBFOOD AUG 550 PE | 1250 | 6.15 | 6.15 |
|
2. SBI Cards and Payment Services Ltd
| Counter | SBICARD LTP 881.25 |
| Call | Buy on dip |
| Target 1 | 950 |
| Target 2 | 1030 |
| Stop Loss | 830 |
| Time Horizon | 3-4 weeks |
| Notes | Buy-On-Dip towards 870 & 850 |
SBI Card was launched in 1998 by the State Bank of India and GE Capital. Incorporated as SBI Cards and Payment Services Private Limited (SBICPSL), SBI Card is headquartered in Gurgaon, Haryana. In December 2017, State Bank of India and The Carlyle Group acquired GE Capital`s stake in SBI Card. The company changed its legal name to SBI Cards and Payments Services Limited in August 2019. In March 2020, SBI Card became the first pure play credit card company to list on the stock exchanges in India.
| Previous Close | 861.5 | TTM EPS | 23.5 |
| 52 Week High | 1028.7 | TTM PE | 37.5 |
| 52 Week Low | 655.7 | P/B | 10.8 |
| Sector PE | 25.2 | Mkt Cap (Rs. Cr.) | 83,412 |
(Source: Moneycontrol, BSE, Fisdom Research)
Technical Outlook

(Source: Fisdom Research)
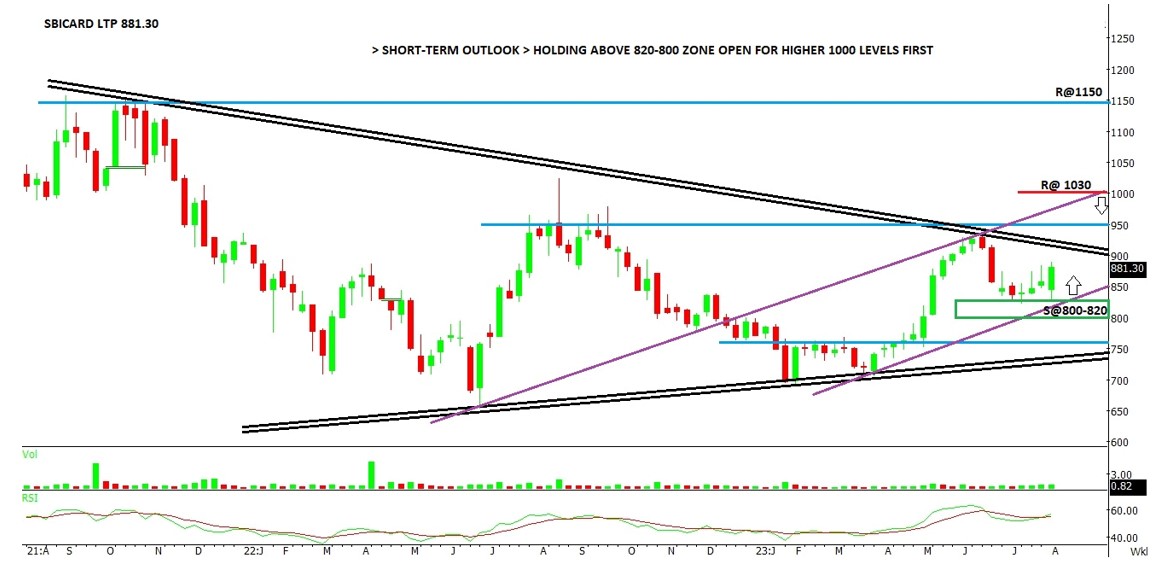
- In the past three months, SBICARD’s stock has been moving within a certain range, specifically between 820 and 940.
- Last month, the stock formed a “Doji” pattern. This month, the developing pattern suggests “Rang to Up”.
- Based on price analysis, there’s a chance that it might aim for higher levels, like 950 and 1030. To achieve this, it needs to stay above 880.
- If the stock manages to stay above 830 and 800, it suggests that the short-term outlook could continue to be positive.
Open Interest

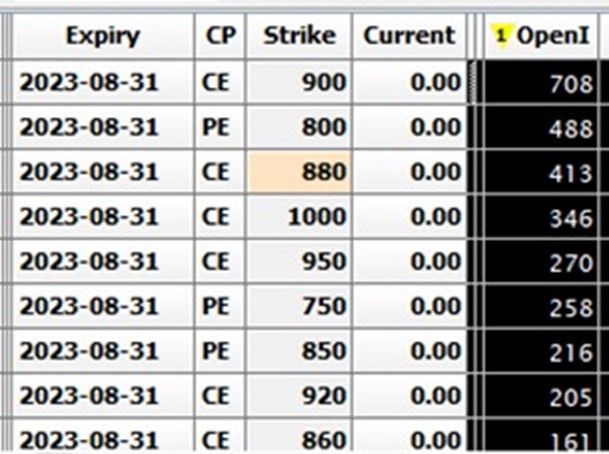
- As per OI data the counter has maximum CE build-up at 900 Strike while maximum PE build-up is at 800 levels which is also a “Tug-Of-War” level between “Buls & Bears” for short to mid-term time-frame.
- Trading above 800 bias is “Range to UP” with hurdles at 900 & next 1000 levels as per OI.
F&O Strategy
| Scrip | SBICARD LTP 881.25 |
| Risk | Moderate |
| Ratio | 1:1:1 |
| Bias | Holding above 830 – “Range to up” |
| Max Reward Expected | ₹ 46,360 |
| Max Risk Expected | ₹ 17,640 |
| Action | Scrip | QTY | IP | LTP |
| BUY | SBICARD AUG FUT | 800 | 885.2 | 885.2 |
| BUY | SBICARD AUG 880 PE | 800 | 22.15 | 22.15 |
| SELL | SBICARD AUG 960 CE | 800 | 5.3 | 5.3 |
|
Disclaimer: This document is not intended for anyone other than the recipient. The contents of this document may not be reproduced or further distributed to any person or entity, whether in whole or in part, for any purpose. If you have received the publication in error please notify the sender immediately. If you are not the named addressee, you should not disseminate, distribute or copy this document. You are hereby notified that disclosing, copying, distributing or taking any action in reliance on the contents of this information is strictly prohibited. All non-authorised reproduction or use of this document will be the responsibility of the user and may lead to legal proceedings. This document has no contractual value and is not and should not be construed as advice or as an offer or the solicitation of an offer or a recommendation to take action in consonance in any jurisdiction. Finwizard Technology Private Limited (“Fisdom”) makes no guarantee, representation or warranty and accepts no responsibility or liability for the accuracy or completeness of the information and/or opinions contained in this document, including any third party information obtained from sources it believes to be reliable but which has not been independently verified. In no event will Fisdom be liable for any damages, losses or liabilities including without limitation, direct or indirect, special, incidental, consequential damages, losses or liabilities, in connection with your use of this document or your reliance on or use or inability to use the information contained in this document, even if you advise us of the possibility of such damages, losses or expenses. Fisdom does not undertake any obligation to issue any further publications or update the contents of this document. The information stated and/or opinion(s) expressed herein are expressed solely as general commentary for general information purposes only and do not constitute advice, solicitation or recommendation to act upon thereof. Fisdom does not have regard to specific investment objectives, financial situation and the particular needs of any specific person who may receive this document. The information contained within this document has not been reviewed in the light of your personal circumstances. Please note that this information is neither intended to aid in decision making for legal, financial or other consulting questions, nor should it be the basis of any investment or other decisions. Fisdom may have issued other similar documents that are inconsistent with and reach different conclusion from the information presented in this document. The relevant offering documents should be read for further details. You should make such researches/inspections/inquiries as it deems necessary to arrive at an independent evaluation of companies referred to in this document (including the merits and risks involved), and should consult its own advisors to determine the merits and risks involved. Fisdom makes no representations that the offerings mentioned in this document are available to persons of any other country or are necessarily suitable for any particular person or appropriate in accordance with their local law. Among other things, this means that the disclosures set forth in this document may not conform to rules of the regulatory bodies of any other country and investment in the offer discussed will not afford the protection offered by the local regulatory regime in any other country. Past performance contained in this document is not a reliable indicator of future performance whilst any forecasts, projections and simulations contained herein should not be relied upon as an indication of future results. The historical performance presented in this document is not indicative of and should not be construed as being indicative of or otherwise used as a proxy for future or specific investments. The relevant product documents should be read for further details. Fisdom does not undertake any obligation to issue any further publications to you or update the contents of this document and such contents are subject to changes at anytime.


