Daily Snippets
Date: 31st July 2023 |
|
|
Technical Overview – Nifty 50 |
|
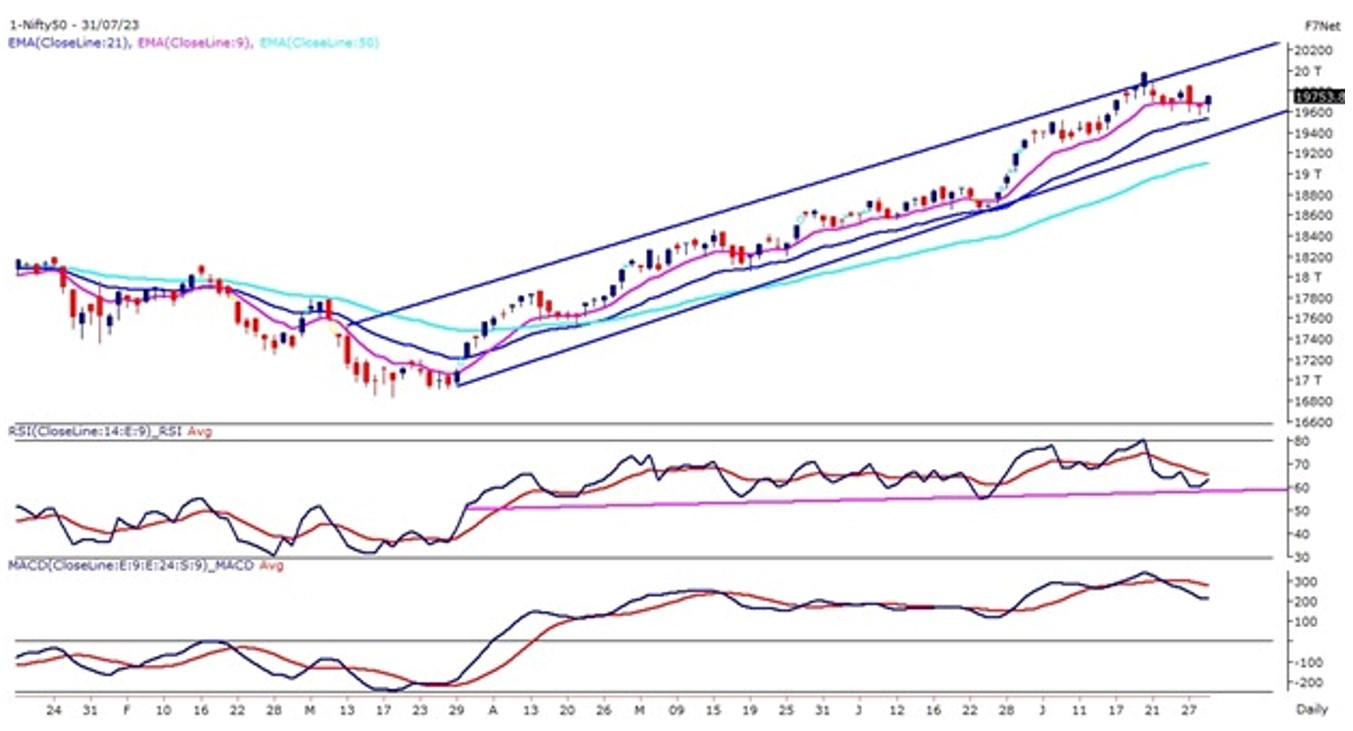
Nifty has witnessed an upside bounce after showing weakness in the last two sessions. The benchmark index on 31st July witnessed a flat opening but slowly and gradually started moving higher above 19,650 levels and witnessed a strong rally towards the end and closed above 19700 levels and given a smaller degree trend line breakout on the intraday chart.
The index from the last couple of sessions was continuously holding above 19,600 levels which indicated a strong demand zone for the index. The momentum oscillator RSI (14) on the daily chart has formed a bullish hidden divergence near 60 levels suggesting a resumption of an upside from the current levels.
On the other hand, on a daily chart, nifty has been moving in higher top higher bottom formation, and constructing a rising channel pattern. At the current junction, 21 EMA is acting as support which is reading at 19530 levels, below this trend line support is placed at 19400 levels. on the upper side, 19850 and 19900 are hurdles for bulls.
|
Technical Overview – Bank Nifty |
|
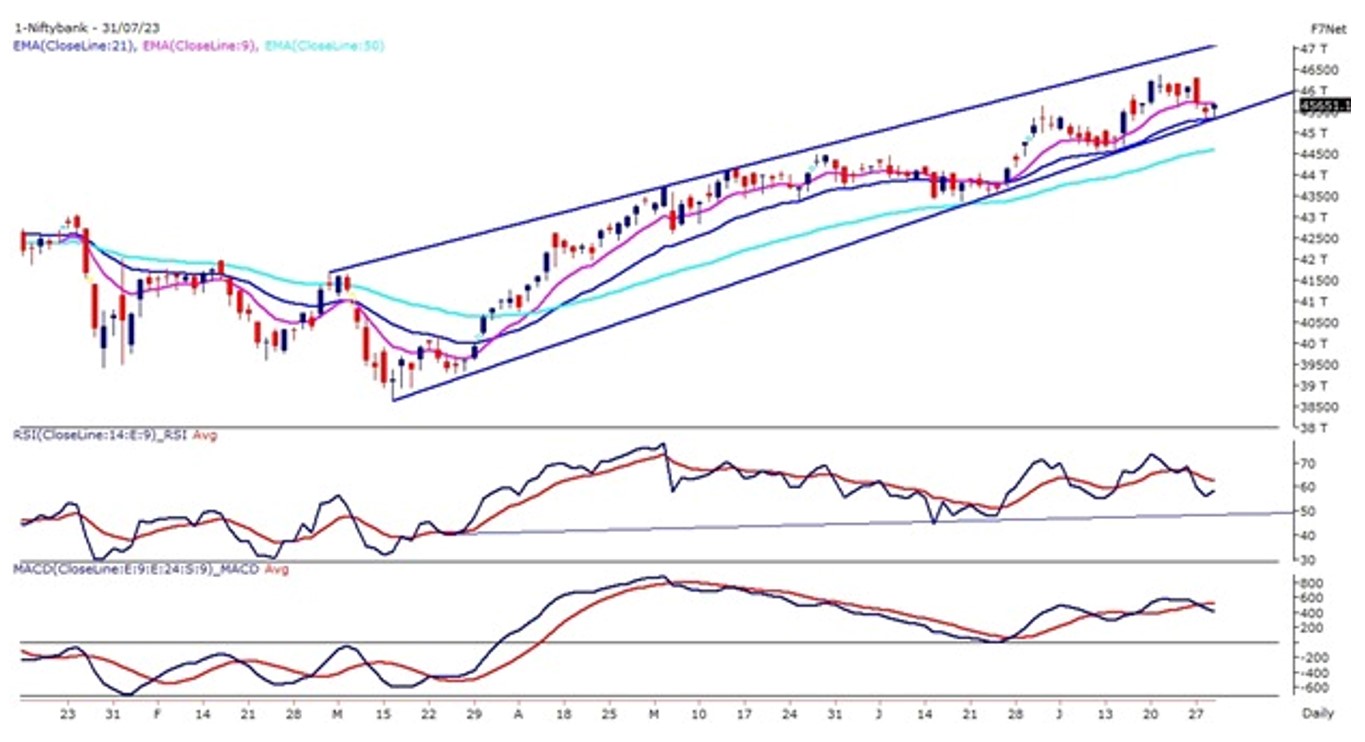
The Bank Nifty on the daily chart continues to trade within the rising wedge pattern and the index presently has taken support near the lower band of the pattern which is placed at 45,400 levels.
Two back-to-back candles on the daily chart with tall shadows indicate buying momentum at lower levels. The banking index is finding support near its 21 EMA which is placed at 45,300 levels. The trend line support and the 21 EMA are merging approximately at the same levels with minor differences on the daily chart suggesting an important support level for the banking index.
The momentum oscillator RSI (14) on the daily chart is reading above its upward-rising trend line support above 50 levels. The immediate support for the Bank Nifty is placed at 45,200 and below that index will witness a breakdown. On the higher end, 45,850 – 46,000 will be an immediate level to watch out for in the Banking index.
|
Indian markets:
- Indian benchmark indices began the week with a positive outlook, breaking a two-day losing streak.
- Despite an initially negative opening, the market quickly recovered in the early hours and continued to gain momentum throughout the day, closing near the day’s high.
- Positive global cues contributed to the market’s overall optimism.
- Asian and European indices showed strong buoyancy, which boosted local market sentiment.
- Sectors that had experienced declines in recent sessions, such as IT, metals, power, and oil & gas, stood out as star performers on this trading day
|
Global Markets
- Most of European markets advanced on Monday as investors digested a dip in euro zone inflation and looked ahead to a key policy decision from the Bank of England.
- According to preliminary data released on Monday, headline inflation in the euro area was 5.3% in July, lower than the 5.5% registered in June.
- Hopes of fewer U.S. interest rate hikes also aided regional markets, after data on Friday showed that the Federal Reserves preferred inflation gauge eased in June.
- Chinese markets firmed on Monday as the State Council outlined more measures to boost domestic consumption and economic growth. The Council unveiled measures aimed chiefly at increasing retail discretionary spending, as well as supporting the real estate and automobile markets.
- US stocks rose Friday as a measure of inflation closely watched by the Federal Reserve came in at its lowest in nearly two years.
|
Stocks in Spotlight
- Despite lukewarm earnings in the quarter ended June, NTPC, the country’s largest power generation company, witnessed a remarkable rally of 4 percent on July 31. The company reported a standalone net profit of Rs 4,066 crore for the first quarter of financial year 2023-24, showing a 9 percent year-on-year growth, while its revenue declined by 2 percent to Rs 39,122 crore. Despite these figures, market sentiment remained positive, and CLSA recommended a ‘buy’ on the stock with a target price of Rs 240, anticipating a rise of 180 bps in the return on equity for NTPC over FY23-25. On the same day, the stock also achieved a significant milestone, hitting a 52-week high of Rs 218.95.
- Siemens experienced a notable increase of over 3 percent in its stock price following a majority of shareholders voting against the sale of its low-voltage motors and geared motors business to Siemens Large Drives India, a subsidiary of Siemens AG. According to the exchange filing dated July 28, approximately 74 percent of the votes opposed the resolution to approve the transactions between the two companies. This decision buoyed investor confidence, and as a result, the stock also achieved a 52-week high of Rs 4068.85 on the same day.
- Bandhan Bank witnessed a 3 percent rise in trading after 1.76 crore shares exchanged hands on the exchanges during early trade, as reported by CNBC-TV18. The deal was valued at Rs 385.4 crore and accounted for 1.1 percent of the total equity of Bandhan Bank. However, the identities of the buyers and sellers involved in the transaction have not been disclosed yet. Notably, on July 21, BNP Paribas had purchased approximately 80 lakh Bandhan Bank shares for Rs 211 in a bulk deal.
|
News from the IPO world🌐
- Concord Biotech, backed by Rakesh Jhunjhunwala’s firm sets IPO price band at Rs. 705-741
- SBFC IPO to kick in from Aug 3
- Textile Manufacturer Shri Techtex to roll out IPO
|
|
Day Leader Board
Nifty 50 Top Gainers | Stock | Change (%) | | NTPC | ▲ 3.60% | | POWERGRID | ▲ 3.00% | | ONGC | ▲ 3.00% | | ADANIPORTS | ▲ 2.80% | | TECHM | ▲ 2.60% |
| Nifty 50 Top Losers | Stock | Change (%) | | APOLLOHOSP | ▼ -3.00% | | BRITANNIA | ▼ -1.90% | | HDFCLIFE | ▼ -1.90% | | BAJFINANCE | ▼ -1.20% | | KOTAKBANK | ▼ -1.10% |
| |
Sectoral Performance | Top Sectors | Day change (%) | | NIFTY METAL | 1.77% | | NIFTY IT | 1.49% | | NIFTY AUTO | 1.10% | | NIFTY OIL & GAS | 1.03% | | NIFTY CONSUMER DURABLES | 0.95% |
|
Advance Decline Ratio | Advance/Declines | Day change (%) | | Advances | 2178 | | Declines | 1509 | | Unchanged | 191 |
|
Numbers to track | Indices Name | Latest | % 1D | % YTD | | Dow Jones (US) | 35,459 | 0.5 % | 7.0 % | | 10 Year Gsec India | 7.2 | 0.30% | 3.80% | | WTI Crude (USD/bbl) | 81 | 0.6 % | 4.7 % | | Gold (INR/10g) | 59,288 | 0.70% | 8.20% | | USD/INR | 82.08 | 0.1 % | (0.7) % |
|
|
Please visit www.fisdom.com for a standard disclaimer.
|
