Daily Snippets
Date: 19th July 2023 |
|
|
Technical Overview – Nifty 50 |
|
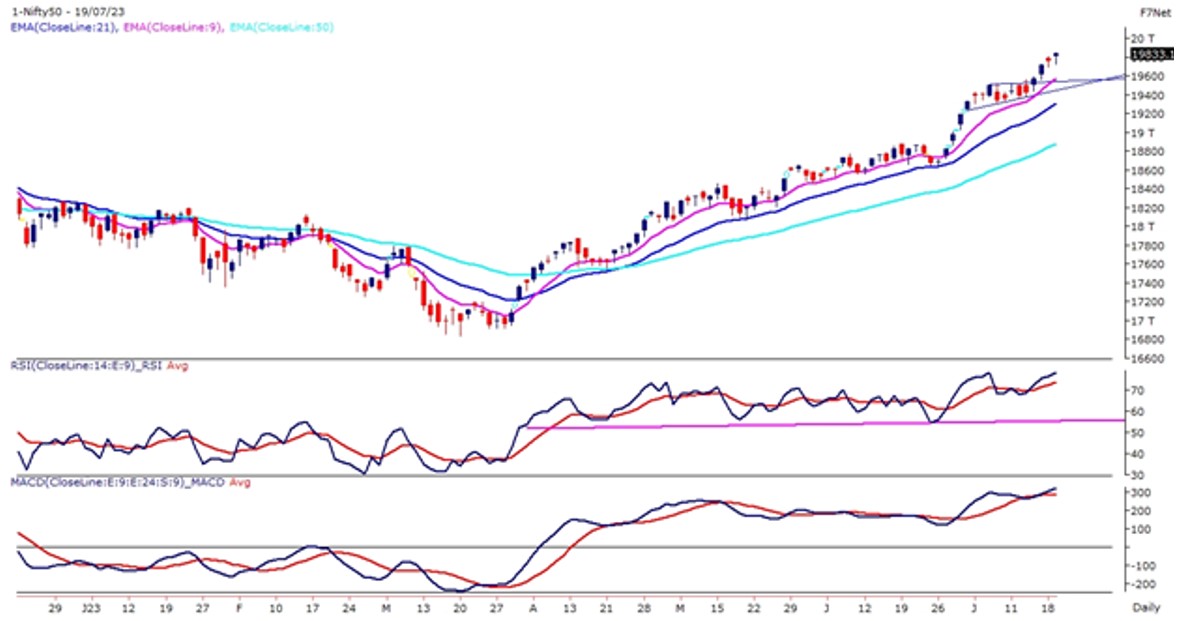
The Benchmark Index witnessed a third consecutive gap-up opening on 19th July and recorded a fresh life high at 19,841 levels. Post-recording its life high an index witnessed an aggressive profit booking with high volatility and again witnessed a sharp V-shape reversal rally and closed at new all-time high levels.
The momentum oscillator on the lower panel continues to stay in a bullish range shift zone and hovers near 70 levels. Similarly, the short-term EMA continues to act as immediate support for the index.
The highest call side open interest is at 20,000 & 19,900 and the highest put side open interest is at 19800. Aggressive call writing is witnessed in the range of 19900-20000 indicating a profit-booking scenario or sideways trend. Technically speaking, Nifty’s technical landscape is now suggesting a desired bullish consolidation with interweek support at the 19600 mark. Nifty’s immediate hurdles are placed at the 19900 mark and then at the 20000 mark.
|
Technical Overview – Bank Nifty |
|
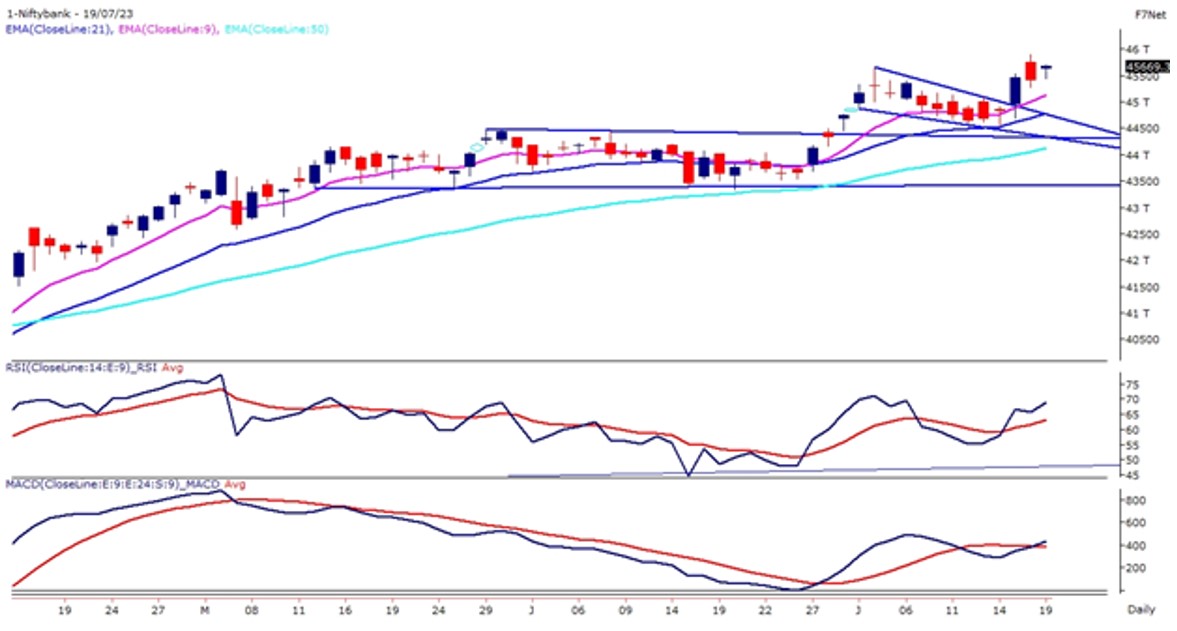
The Bank Nifty witnessed another gap-up opening but prices responded well compared to the benchmark index and found strong support near 9 EMA and post that moved higher to close above 45,600 levels. The prices have formed an inside day candle on the daily time frame.
The highest call side open interest is at 46,000 & 45,800 and the highest put side open interest is at 45,500. Aggressive call writing is witnessed in the range of 45,700-46,000 indicating a profit-booking scenario or sideways trend.
The momentum oscillator on the lower panel continues to stay above 60 levels on the daily chart. Similarly, the short-term EMA continues to act as immediate support for the Banking index which is placed at 45,000 levels.
Technically speaking, Bank Nifty’s technical landscape is now suggesting a desired bullish consolidation with interweek support at the 45,200 mark. Bank Nifty’s immediate hurdles are placed at the 46,000 level.
|
Indian markets:
- Indian benchmark indices continued their winning streak for the fifth consecutive session on July 19, with both the Sensex and Nifty showing gains.
- The Sensex closed up by 302.30 points or 0.45 percent at 67,097.44, while the Nifty gained 83.90 points or 0.42 percent to close at 19,833.20.
- The market started positively and reached fresh record highs, but later experienced profit booking, leading to a pullback from the peak levels.
- However, the market witnessed last-hour buying, which helped it recover and close near the day’s high level.
- Among the Nifty’s top gainers were NTPC, Bajaj Finance, IndusInd Bank, UltraTech Cement, and Bajaj Finserv, while the losers included Hindalco Industries, Bajaj Auto, Hero MotoCorp, TCS, and Maruti Suzuki.
- Notably, all sectors ended in the green, with PSU Bank leading the gains, up by 2 percent, followed by power, healthcare, and oil & gas, each rising by 0.5 percent.
|
Global Markets
- Asia’s stock markets were mixed on Wednesday with growth concerns dragging on China’s equities while shares gained in Japan and Australia after healthy U.S. company earnings and retail data added to hopes that a recession there can be avoided.
- Dovish remarks from a European Central Bank policymaker boosted bonds and dragged the euro lower. Hotter-than-expected inflation lifted the New Zealand dollar a little and stoked some market nerves ahead of British CPI due later in the day.
- Headline U.S. retail sales data came in below forecasts, but core sales which exclude food, fuel and building materials, rose a solid 0.6% in June and had economists lifting GDP forecasts.
|
Stocks in Spotlight
- NTPC shares surged following a positive buy rating from Goldman Sachs, a foreign brokerage firm. The rating considers NTPC as a top pick and comes with a target price of Rs 265, implying a potential upside of 42 percent. Goldman Sachs highlighted two main factors contributing to NTPC’s growth in India’s power sector: the opportunities presented by the renewable energy transition, leading to higher returns and a broader customer base, and NTPC’s advantage of low-cost debt, positioning it as a leader in addressing the current peak power deficit cycle caused by rising demand and insufficient capacity addition.
- ICICI Prudential Life Insurance shares dropped nearly 3 percent after the company reported a 4 percent year-on-year decline in annualised premium equivalent (APE) to Rs 1,461 crore for the quarter ending June 2023. Additionally, the insurer’s value of new business (VNB), representing the present value of future profits, stood at Rs 438 crore in the April-June quarter, showing a 7 percent decrease compared to the previous year.
- IndusInd Bank surged 4 percent to reach a 52-week high of Rs 1,443.40 in early trade, driven by the bank’s strong financial performance in the April-June quarter. The lender reported a net profit of Rs 2,124 crore for the quarter, marking a significant 33 percent increase from the previous year’s figure of Rs 1,631 crore. The positive results were well-received by most brokerages, contributing to the boost in investor sentiment. As of 9.20 am, the stock was trading 3.2 percent higher at Rs 1,435 on the National Stock Exchange, aligning with CNBC-TV18’s estimate of Rs 2,127 crore net profit.
|
News from the IPO world🌐
- IPO bound OYO strengthens its premium play
- Ola advances plan for IPO and electric scooters take off in India
- Netweb Technologies IPO subscribed 27 times on day 3
|
|
Day Leader Board
Nifty 50 Top Gainers | Stock | Change (%) | | NTPC | ▲ 2.90% | | BAJFINANCE | ▲ 2.40% | | INDUSINDBK | ▲ 2.20% | | ULTRACEMCO | ▲ 2.10% | | BAJAJFINSV | ▲ 1.90% |
| Nifty 50 Top Losers | Stock | Change (%) | | HINDALCO | ▼ -1.10% | | HEROMOTOCO | ▼ -0.90% | | TCS | ▼ -0.80% | | BAJAJ-AUTO | ▼ -0.60% | | MARUTI | ▼ -0.60% |
| |
Sectoral Performance | Top Sectors | Day change (%) | | NIFTY PSU BANK | 1.95% | | NIFTY MEDIA | 1.13% | | NIFTY CONSUMER DURABLES | 0.97% | | NIFTY OIL & GAS | 0.66% | | NIFTY BANK | 0.57% |
|
Advance Decline Ratio | Advance/Declines | Day change (%) | | Advances | 1998 | | Declines | 1413 | | Unchanged | 126 |
|
Numbers to track | Indices Name | Latest | % 1D | % YTD | | Dow Jones (US) | 34,951 | 1.1 % | 5.5 % | | 10 Year Gsec India | 7.1 | 0.30% | 2.90% | | WTI Crude (USD/bbl) | 74 | (1.7) % | (3.6) % | | Gold (INR/10g) | 59,633 | -0.10% | 7.70% | | USD/INR | 82.13 | 0.0 % | (0.7) % |
|
|
Please visit www.fisdom.com for a standard disclaimer.
|
