Daily Snippets
Date: 17th July 2023 |
|
|
Technical Overview – Nifty 50 |
|
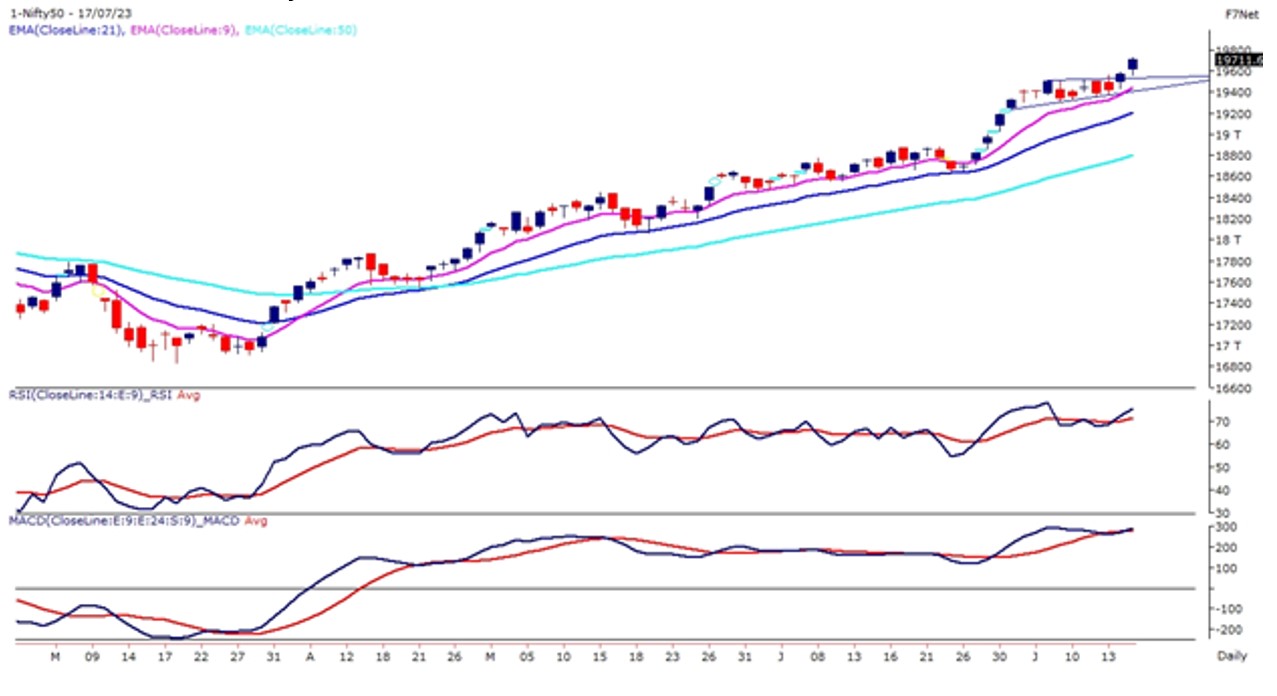
Nifty50 continued its bullish momentum and recorded a lifetime high of 19,731 levels and closed near the day’s high with a 0.75% gain on 17th July 2023. The saga of new highs continued for the benchmarks in today’s session as well and Prices on the daily chart witnessed a bullish flag pattern breakout. Now that Nifty has surpassed its key hurdles above the psychological 19700 mark, we suspect, there is room for further upside.
The overall trend still appears positive in the near term as the support is shifting higher. In all the time frames benchmark index is moving in a higher top higher bottom formation. The unfilled gap on the weekly and monthly time frame, between 19,200 to 19,235 may act as a strong demand zone. The highest OI on the call side is placed at 20,000 followed by 19,700 and the highest OI on the put side is placed at 19,600 followed by 19,500.
Option data seems to be in the favor of bulls and the option chain suggests the same as PCR stands at 1.55.
The PCR levels are currently very near to the overbought zone so fresh longs should be entered only on dips. The immediate support for the Nifty stands near its 9 EMA which is placed at 19,450 levels and the upper band for the index is capped below 19,750 – 19,800 levels.
|
Technical Overview – Bank Nifty |
|
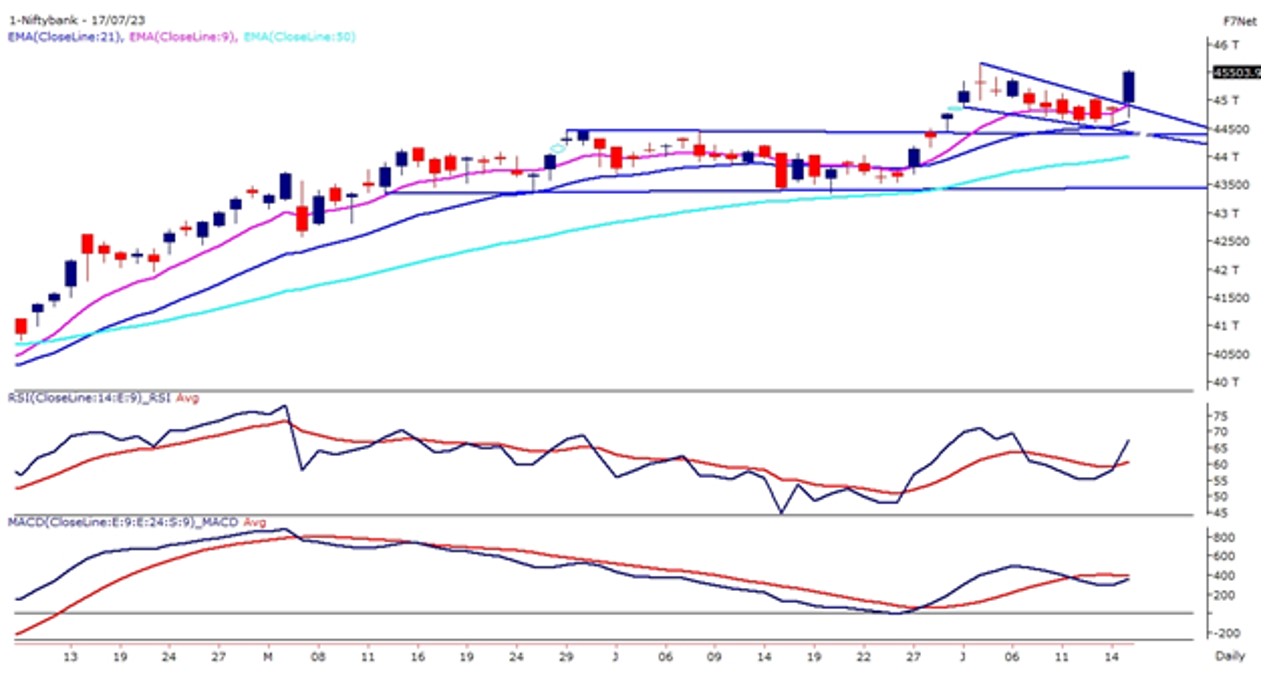
The Bank Nifty on 17th July witnessed a flattish opening and traded below 44, 800 levels in the pre-lunch session. In the second half of the market prices were indicating a demand from lower levels and the Banking index crossed 45, 000 levels. But a strong emerged in the final 30 mins of trade and the banking index rallied almost 250 points and closed at the day’s highest levels.
The Bank Nifty today has broken out of a flag pattern on the daily chart indicating that the consolidation phase is over and it is likely to witness a sharp surge over the next few trading sessions. The momentum oscillator RSI (14) has taken support near 50 levels and moved up with a bullish crossover. The highest OI on the call side is placed at 45,500 followed by 46,000 and the highest OI on the put side is placed at 45,000 followed by 44,800. Option data still seems to be in the favor of bulls and the option chain suggests the same as PCR stands at 1.56.
The PCR levels are currently very near the overbought zone so sideways consolidation may occur. The immediate support for the Bank Nifty stands near its 9 EMA which is placed at 44,910 levels and the upper band for the index is capped below 45,650 – 45,800 levels.
|
Indian markets:
- Local indices (Sensex and Nifty) ended with strong gains on Monday, marking the third consecutive session of upward movement.
- Both Sensex and Nifty achieved record closing high levels.
- Media, banking, and financial services shares experienced a rally, contributing to the overall market gains.
- On the other hand, auto and realty stocks witnessed a decline in value.
- The Nifty reached an all-time high of 19,731.85, while the Sensex hit a record level of 66,656.21 in late trade.
|
Global Markets
- European and Asian stocks declined on Monday as investors digested key economic data from China. The Japanese stock market is closed today on account of Marine Day national holiday.
- Chinas economy grew slightly more than expected in the second quarter of 2023, but growth still slowed substantially from the prior quarter as a post-COVID economic recovery ran out of steam.
- Chinas second quarter gross domestic product (GDP) grew 0.8% from the prior quarter, data from the National Bureau of Statistics showed on Monday. The reading was slightly above expectations for growth of 0.5%, but slowed substantially from the 2.2% seen in the prior quarter.
- Meanwhile, the U.S. markets were mixed on Friday, with the Dow Jones Industrial Average reaching its highest level since March as strong earnings results from some of the biggest banks and companies kicked off earnings season.
|
Stocks in Spotlight
- Dr. Reddy’s Laboratories surged following the announcement of its agreement to acquire a 26 percent stake in O2 Renewable Energy IX Private Limited. The pharmaceutical company signed a pact with TEQ Green Power XI Pvt Ltd and O2 Power SG Pte Ltd to purchase the stake in the renewable energy firm. This move reflects Dr. Reddy’s Laboratories’ commitment to expanding its presence in the renewable energy sector.
- Avenue Supermarts shares experienced a 3 percent decline on July 17 following the company’s report of a 140 basis points decrease in EBITDA margins during the April to June quarter. The EBITDA margins dropped to 8.9 percent, down from the same quarter in the previous year. However, in Q1FY24, the company’s standalone net profit increased by 2.3 percent YoY to Rs 695 crore, and standalone revenue from operations grew by 18.1 percent YoY to Rs 11,584 crore.
- JBM Auto soared 11.5 percent on July 14 after the company and its subsidiaries won orders for approximately 5,000 electric buses to supply to various STUs in the states of Gujarat, Haryana, Delhi, Telangana, Orissa among others and multiple Fortune 500 companies coupled with leading corporates of the country, the company said in an exchange filing. The stock also hit a 52-week high of Rs 1,539.60 on the same day.
|
News from the IPO world🌐
- Matrix Gas and Renewables files IPO papers, raises Rs. 7.45 crore via private placement
- Ola advances plan for IPO and electric scooters take off in India
- Netweb Technologies IPO subscribed 2.33 times on day 1
|
|
Day Leader Board
Nifty 50 Top Gainers | Stock | Change (%) | | SBIN | ▲ 3.00% | | WIPRO | ▲ 2.70% | | DRREDDY | ▲ 2.50% | | GRASIM | ▲ 2.30% | | HDFCBANK | ▲ 2.10% |
| Nifty 50 Top Losers | Stock | Change (%) | | ONGC | ▼ -1.70% | | HEROMOTOCO | ▼ -1.30% | | TATAMOTORS | ▼ -0.90% | | TITAN | ▼ -0.90% | | BHARTIARTL | ▼ -0.90% |
| |
Sectoral Performance | Top Sectors | Day change (%) | | NIFTY MEDIA | 3.15% | | NIFTY PSU BANK | 2.25% | | NIFTY BANK | 1.41% | | NIFTY PRIVATE BANK | 1.33% | | NIFTY FINANCIAL SERVICES | 1.25% |
|
Advance Decline Ratio | Advance/Declines | Day change (%) | | Advances | 1993 | | Declines | 1676 | | Unchanged | 186 |
|
Numbers to track | Indices Name | Latest | % 1D | % YTD | | Dow Jones (US) | 34,509 | 0.3 % | 4.1 % | | 10 Year Gsec India | 7.1 | -0.20% | -3.40% | | WTI Crude (USD/bbl) | 75 | (1.9) % | (2.0) % | | Gold (INR/10g) | 59,229 | 0.10% | 8.10% | | USD/INR | 82.1 | 0.1 % | (0.7) % |
|
|
Please visit www.fisdom.com for a standard disclaimer.
|
