Daily Snippets
Date: 30th June 2023 |
|
The Markets Today in a nutshell |
|
Technical Overview – Nifty 50 |
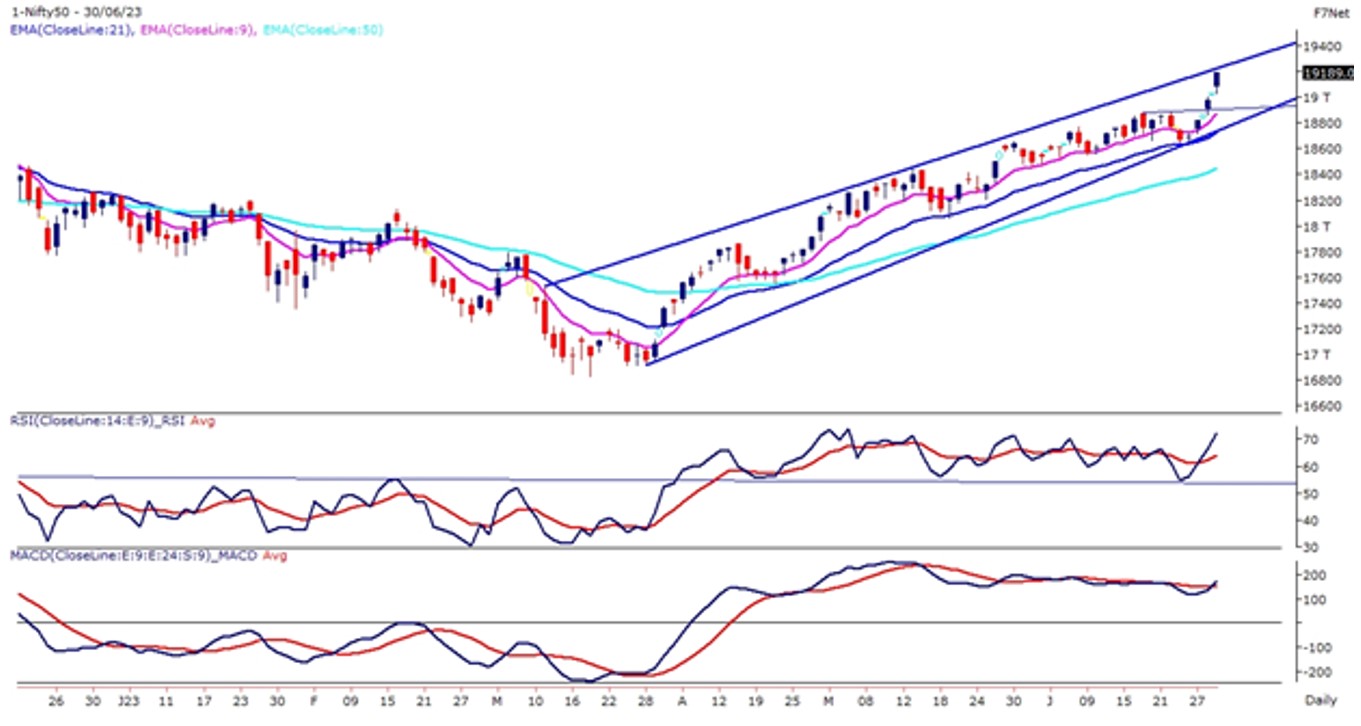 |
Nifty rises further into uncharted territory. The running of bulls is likely to continue at Dalal Street as Nifty bulls are showing a lot of resilience. The short covering rally on the 1st day of July month expiry propelled Nifty at 19,189 levels. Nifty opened with a gap move & continues its higher top-higher bottom formation forming a lifetime high.
The index has closed at lifetime high levels. Foreign institutional investors (FIIs) have shown significant buying interest, contributing to the indices’ upward movement. The benchmark index on the daily chart is trading within the rising channel pattern and presently has reached near the upper band of the pattern. The weekly PCR ratio has reached 1.63 levels which is an extremely overbought. range.
The broader market perspective remains bullish but an immediate profit booking at current levels cannot be ruled out. Immediate support is near 19,000 levels while resistance is near 19300 levels.
|
Technical Overview – Bank Nifty |
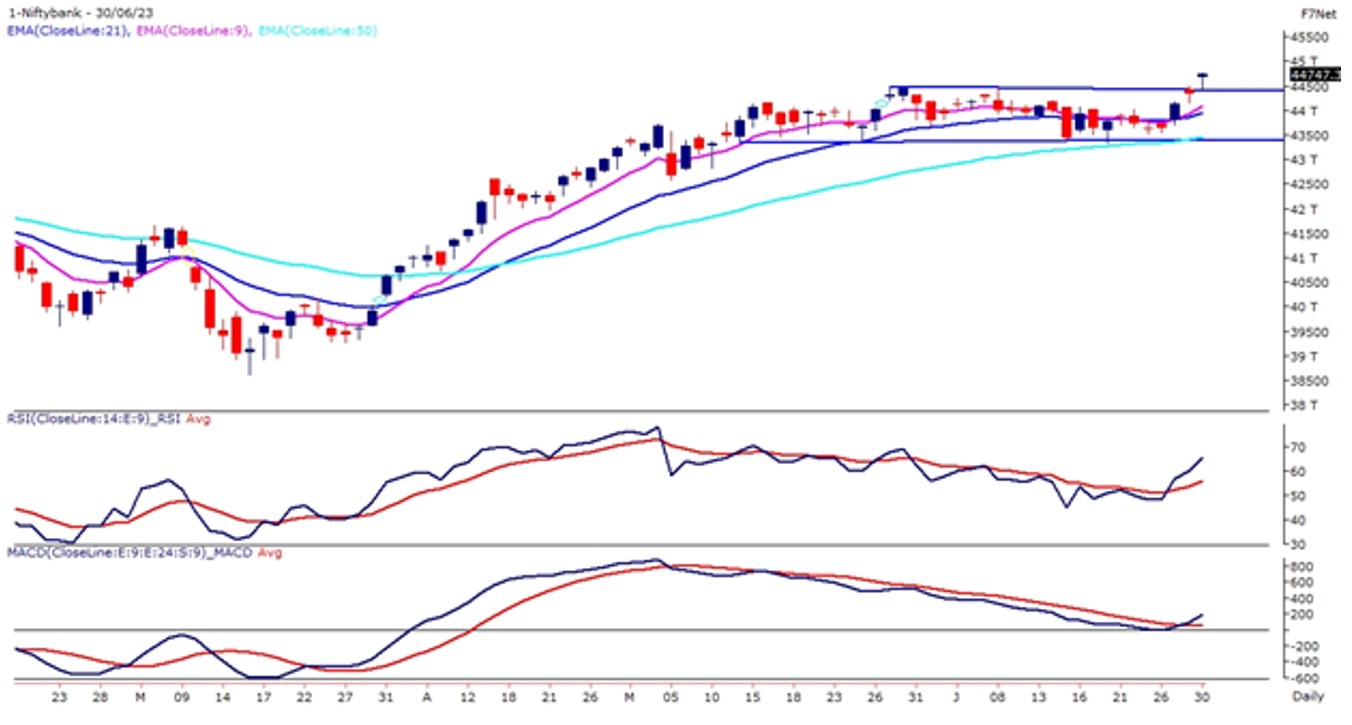 |
The Bank Nifty on the daily chart has finally witnessed a breakout of a rectangle pattern and the index closed above the upper band of the patterns. Bank Nifty is trending above the golden cross on the daily chart. Technically, the bullish crossover of 9EMA over 21EMA is known as the ‘golden cross’ – the short to medium-term bullish trend.
As Bank Nifty powers through the previous all-time high of 44151 & approaching near to its psychological 45,000 mark, PUT Writers seem to be more aggressive. (53.28Lks PUT OI added Vs only 25.71Lks for CALLs).
The Bank Nifty on the weekly chart has engulfed its previous week’s candle which indicates bulls are actively marching higher. Any dip in the index should be considered a fresh buying opportunity until prices are trading above 44,100 levels while resistance is near 45,000 – 45,250 levels.
|
Indian markets
- Domestic equity benchmarks reached new all-time highs on Friday, showcasing robust performance across the board.
- The rally in the market was driven by multiple factors both at the local and global level.
- Positive global cues played a substantial role in buoying investor sentiment, contributing to the uptick in domestic equities.
- An encouraging revision of Q1 GDP figures at the global level provided a solid impetus to the market.
- The global market was also positively impacted by a decrease in jobless claims, signaling economic recovery and improved business conditions.
- The success of the Federal Reserve’s US bank stress test further underpinned the global market, instilling confidence among investors.
- Back home, the progression of the southwest monsoon added to the optimism, as it is a crucial factor for India’s agricultural economy and rural demand.
- Overall, a convergence of local and global positive factors created a conducive environment for the equity market surge.
|
Global Markets
- The Dow Jones index futures were up 89 points, indicating a positive opening in US stocks today.
- European shares advanced on Friday after a set of strong U.S. economic data bolstered the view that the Federal Reserve will likely keep interest rates higher for longer.
- Chinas factory activity in June contracted for a third month, with the official manufacturing purchasing managers index (PMI) coming in at 49.0. This was below the previous reading of 49.2 and below the 50 level that separates contraction from expansion. German consumer price inflation unexpectedly increased to 6.4% (y-o-y) in June, rising from the 14-month low of 6.1% recorded in May.
- US stocks rallied on Thursday, led by banking stocks following better-than-expected data that raised hopes the US economy could avert a recession. Large US banks passed a Federal Reserve stress test, generating speculation of potential dividend hikes and share buybacks.
- Fed Chair Jerome Powell signaled on Thursday that the U.S. central bank was likely to resume its monetary tightening campaign after a break earlier this month.
|
Stocks in Spotlight
- HDFC AMC stock experienced a 12% surge on June 30, a spike attributed to the Securities and Exchange Board of India’s (SEBI) decision to defer the rationalization of the total expense ratio (TER). The TER comprises the costs that mutual fund schemes can levy on their investors. The market regulator’s anticipated move to include additional charges within the TER limits had set alarm bells ringing among the Asset Management Companies (AMCs), fearing a dip in their profitability.
- Mahindra and Mahindra Ltd (M&M) soared over 3% to a 52-week high of Rs 1,450 on June 30, a day after earning the distinction of being the first company to qualify under the government’s production-linked incentive (PLI) scheme for automobiles. This crucial milestone paves the way for M&M to avail of subsidies from a massive Rs 25,938-crore scheme aimed at turbocharging domestic production, job creation, and overall economic growth.
- Canara Bank were buoyed, trading approximately 2% higher in afternoon transactions, following its board of directors’ sanction of a Rs 7,500-crore fundraising initiative for the current fiscal year. The bank plans to amass Rs 3,500 crore via additional Tier I bonds. The remaining Rs 4,000 crore will be raised through Tier II bonds.
|
Read More- Peak to Peak Journey |
News from the IPO world🌐
- TATA Technologies, SBFC Finance and Gandhar Oil Refinery IPO approved by SEBI
- Mukka Proteins refiles DRHP with SEBI to launch IPO
- Afcons begins IPO talks with banks.
|
Day Leader Board
Nifty50 Top Gainers
| Stock |
Change (%) |
| M&M |
▲ 4.40% |
| INFY |
▲ 3.40% |
| INDUSINDBK |
▲ 3.20% |
| SUNPHARMA |
▲ 2.90% |
| HEROMOTOCO |
▲ 2.70% |
|
Nifty50 Top Losers
| Stock |
Change (%) |
| ADANIPORTS |
▼ -2.20% |
| HDFCLIFE |
▼ -0.50% |
| APOLLOHOSP |
▼ -0.50% |
| GRASIM |
▼ -0.50% |
| ADANIENT |
▼ -0.50% |
|
|
Sectoral Performance | Top Sectors | Day change (%) | | NIFTY IT | 2.50% | | NIFTY AUTO | 2.07% | | NIFTY PSU BANK | 2.06% | | NIFTY PRIVATE BANK | 1.17% | | NIFTY PHARMA | 1.06% |
|
Advance Decline Ratio | Advance/Declines | Day change (%) | | Advances | 1890 | | Declines | 1627 | | Unchanged | 131 |
|
Numbers📈 that matter | Indices Name | Latest | % 1D | % YTD | | Dow Jones (US) | 34,122 | 0.4 % | (9.2) % | | 10 Year Gsec India | 7.1 | 0.90% | -2.60% | | WTI Crude (USD/bbl) | 70 | 0.4 % | (9.2) % | | Gold (INR/10g) | 59,626 | -0.30% | 6.10% | | USD/INR | 81.99 | (0.0) % | (0.8) % |
|
Please visit www.fisdom.com for a standard disclaimer. |


