Mutual Fund Industry Asset Under Management
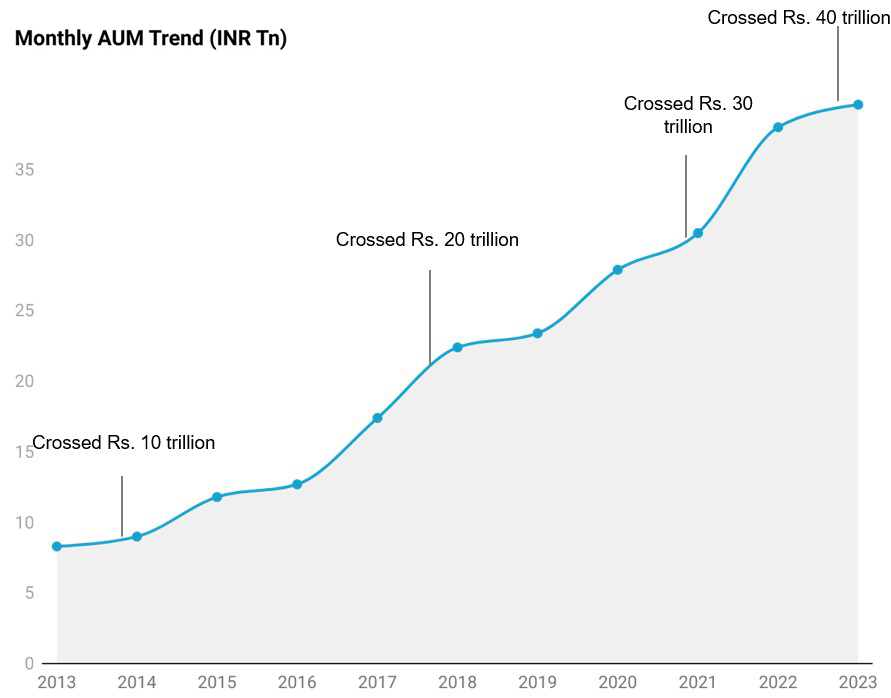
Aum slows down amid equity market volatility

Latest Data point as on Jan 2023
Chart: Fisdom Research • Source: AMFI • Created with Datawrapper
| Date | AUM (INR Tn) | Trillion Growth | Years Taken | Milestones |
| Jan-13 | ₹ 8.30 | |||
| Jan-14 | ₹ 9.00 | |||
| Jan-15 | ₹ 11.80 | ₹ 4 | 2 | Crossed INR. 10 Trillion |
| Jan-16 | ₹ 12.70 | |||
| Jan-17 | ₹ 17.40 | |||
| Jan-18 | ₹ 22.40 | ₹ 11 | 3 | Crossed INR. 20 Trillion |
| Jan-19 | ₹ 23.40 | |||
| Jan-20 | ₹ 27.90 | |||
| Jan-21 | ₹ 30.50 | ₹ 8 | 3 | Touched INR. 30 Trillion |
| Jan-22 | ₹ 38.00 | |||
| Jan-23 | ₹ 39.60 | ₹ 9 | 2 | Crossed INR. 40 Trillion |
- MF Industry AUM declined in the first month of CY2023. MF industry AUM was down on a m-o-m basis by 0.7 percent. However, industry AUM increased by 4.2 percent on y-o-y basis. The AUM has declined post touching an all time high of Rs. 40.4 trn in Nov’22. However, overall industry witnessed inflows of Rs. 11,373 crore in Jan’23 vs Rs. 4,491 crore in the Dec’22.
- The MF industry AUM growth trajectory has been a steep one while several milestones being achieved in a very short span of time. Multiple awareness campaigns about mutual funds by AMFI, strong retail participation, consistent SIP flows and a broad-based market rally were key drivers behind it.
Equity & Debt Asset Under Management
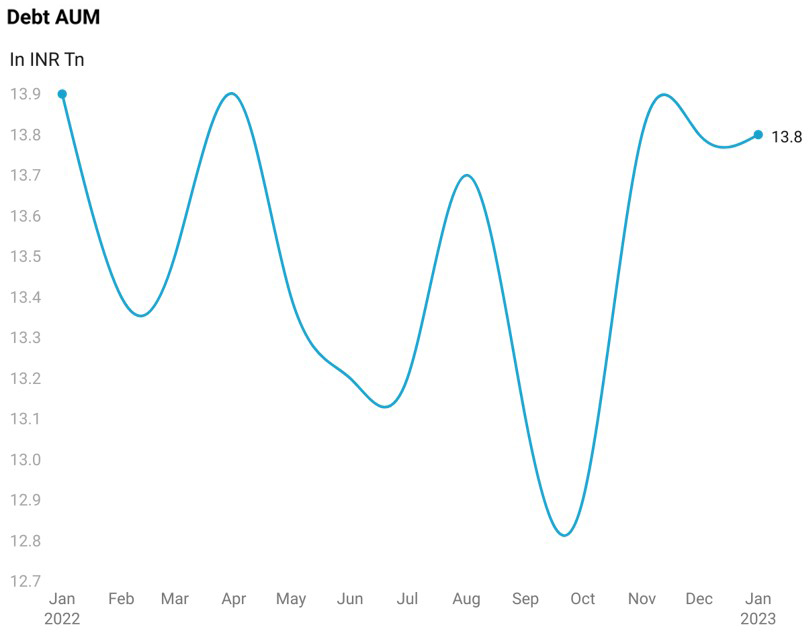
Equity AUM decline; Debt AUM flat

Chart: Fisdom Research • Source: ACEMF • Created with Datawrapper

Chart: Fisdom Research • Source: ACEMF • Created with Datawrapper
- MF Equity AUM continued to decline for the second consecutive month. Total equity AUM declined by 1.3 percent on a m-o-m basis. However, the AUM is up by 12.3 percent on a y-o-y basis. Nifty 50 during Jan’23 has corrected by 2.44 percent; on the other hand the overall equity mutual funds inflows hit 4 month high at Rs. 12,546 crore. Inflows in equity categories balanced out the overall equity market decline in Jan’23
- On the contrary debt AUM saw a modest uptick of 0.08 percent in Jan’23. Though debt categories continue to witness outflows, new fund offers offered some relief. Total 18 new fund offers were launched in debt category including FMPs. The interest rate cycle is close to, and street estimate fully peaked, out yet; hence, the debt category flows may see some pressure in the short term.
Top 10 AMCs by AUM
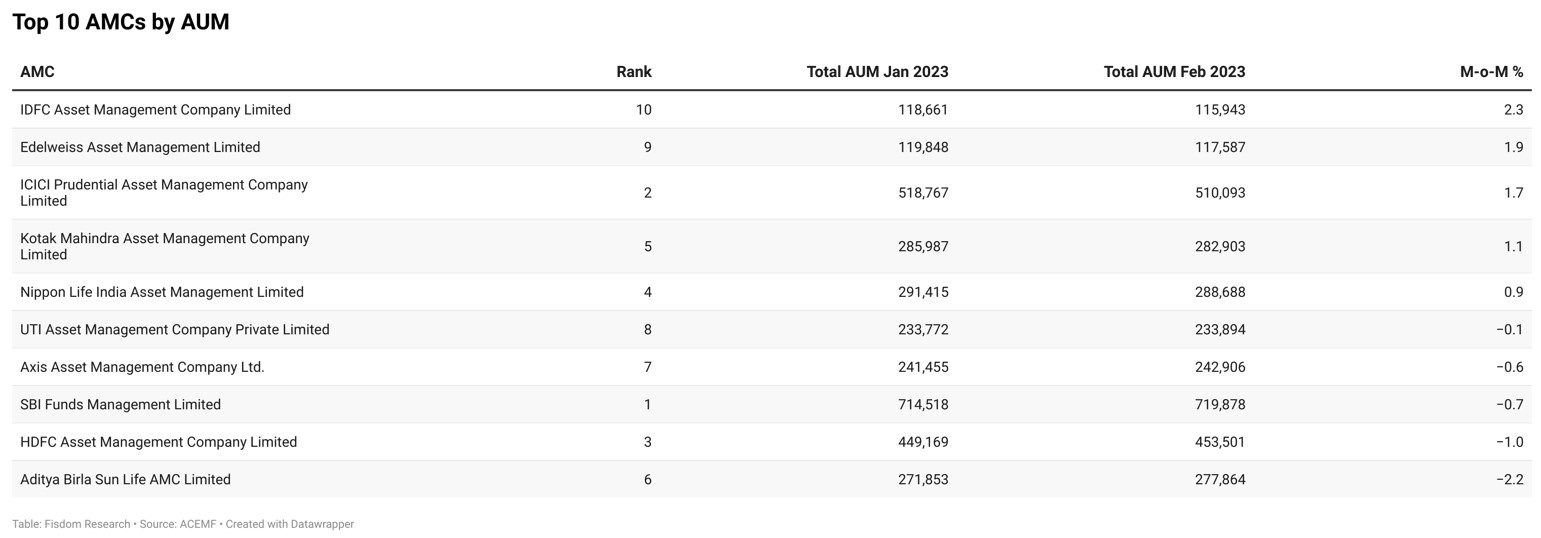
5 of the top 10 AMCs witness AUM growth; IDFC AMC sees AUM uptick

- 5 of the top 10 AMC’s saw uptick in AUM with IDFC AMC leading the board. IDFC Equity AUM saw a decline of 0.3 percent where as Debt AUM saw an increase of 3.2 percent. Edelweiss AMC was the second best performer in terms of AUM growth last month Edelweiss AMCs was the top performer amid increase in debt AUM.
- ABSL AMC which saw the highest decline in AUM among top 10 AMCs witnessed decline in both Equity and Debt AUM.
- On an overall basis top 10 AMC AUM growth was 0.1 percent higher vs overall MF industry AUM declined of 0.7 percent.
Category Wise Inflows/Outflows: Equity Categories
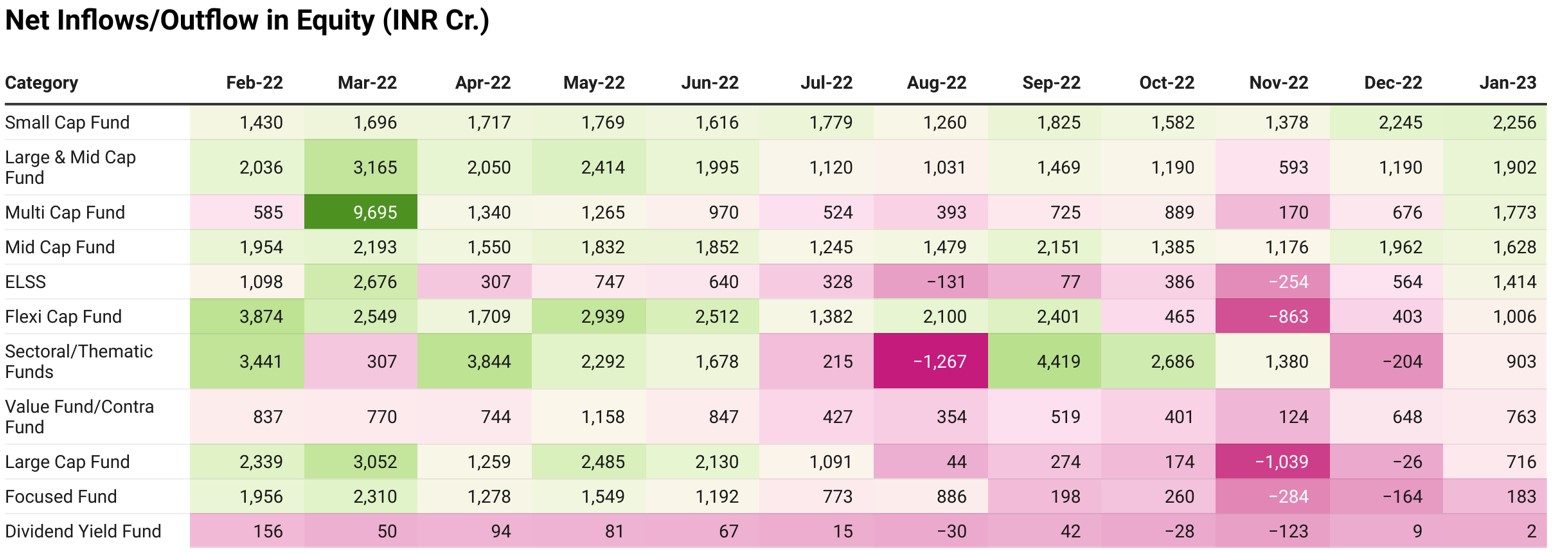
Midcaps & small-cap categories continued receiving inflows

Chart: Fisdom Research • Source: ACEMF • Created with Datawrapper
- Large-cap-oriented categories saw modest inflows after two months of consecutive decline. Small and midcap category continued their momentum reflecting value buying taking center stage. The inflows were persistent in small and midcaps amid value buying since very few equity NFOs were launched in equity category during Jan’23.
- Considering the reasonable risk returns tradeoff in midcap & smallcap and the valuations tradeoff vis-à-vis large-cap, in line with our expectations, both these categories are receiving inflows and expected to do the same in near term.


