

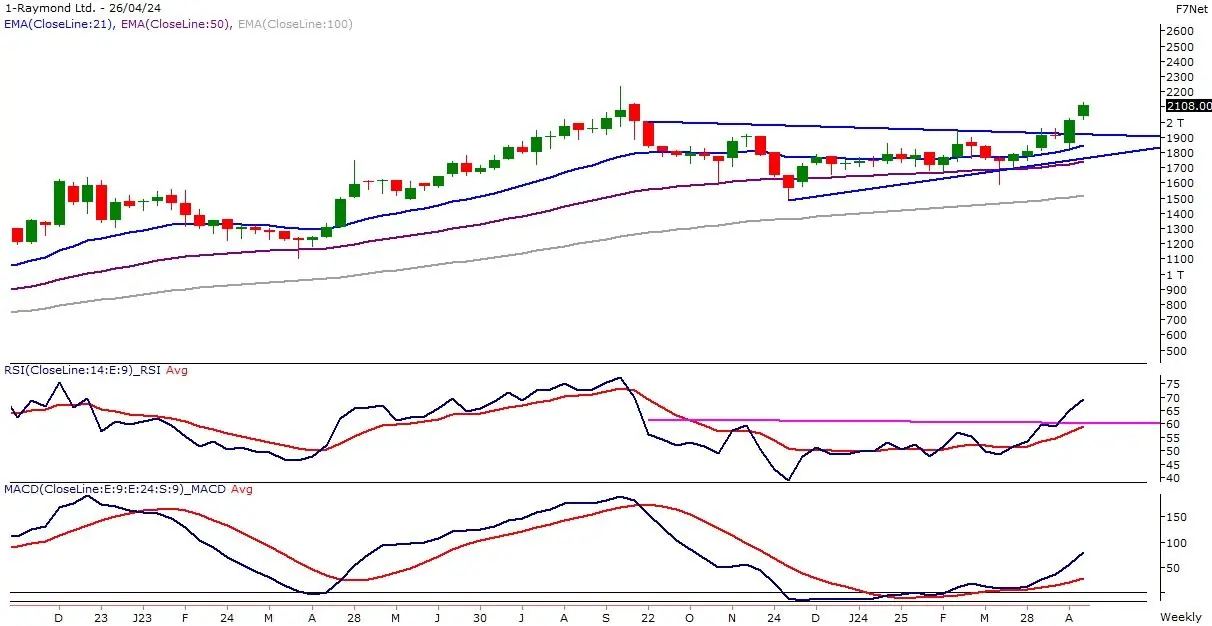
| Counter | RAYMOND LTP 2,108 |
| Call | Buy on dip |
| Target 1 | 2,225 |
| Target 2 | 2,325 |
| Stop Loss | 1,960 |
| Time Horizon | 2-3 weeks |
| Notes | 50% Buy on dip at 2,070 |
Raymond Ltd specializes in the textile and apparel industry, with operations spanning several divisions including Textile, Real Estate Development, Shirting, Apparel, Garments, Tools and Hardware, Auto Components, and more, which encompass both apparel and non-scheduled airline operations. Its primary revenue stream comes from the textile sector. The company’s brand portfolio includes renowned names like Park Avenue, Raymond, ColorPlus, Parx, and Ethnix, among others.
| Previous Close | 2,120.40 | TTM EPS | 241.05 |
| 52 Week High | 2,240.00 | TTM PE | 8.74 |
| 52 Week Low | 1,487.60 | P/B | 4.85 |
| Sector PE | 31.90 | Mkt Cap (Rs. Cr.) | 14,032 |
(Source: Fisdom research)
|
| Counter | CDSL LTP 2,119 |
| Call | Buy on dip |
| Target 1 | 2,235 |
| Target 2 | 2,335 |
| Stop Loss | 1,970 |
| Time Horizon | 2-3 weeks |
| Notes | 50% Buy on dip at 2,076 |
Central Depository Services (India) Ltd functions as a securities depository within India, providing dematerialization services for various securities such as equity shares, preference shares, mutual fund units, debt instruments, and government securities. The company is structured into operating business segments, namely Depository Activity, Data Entry and Storage, and Repository, with the Depository Activity segment contributing the highest revenue.
| Previous Close | 2,151.00 | TTM EPS | 33.78 |
| 52 Week High | 2,195.35 | TTM PE | 62.74 |
| 52 Week Low | 973.50 | P/B | 18.25 |
| Sector PE | 46.07 | Mkt Cap (Rs. Cr.) | 22,148 |
(Source: Fisdom research)
|
Disclaimer: This document is not intended for anyone other than the recipient. The contents of this document may not be reproduced or further distributed to any person or entity, whether in whole or in part, for any purpose. If you have received the publication in error please notify the sender immediately. If you are not the named addressee, you should not disseminate, distribute or copy this document. You are hereby notified that disclosing, copying, distributing or taking any action in reliance on the contents of this information is strictly prohibited. All non-authorised reproduction or use of this document will be the responsibility of the user and may lead to legal proceedings. This document has no contractual value and is not and should not be construed as advice or as an offer or the solicitation of an offer or a recommendation to take action in consonance in any jurisdiction. Finwizard Technology Private Limited (“Fisdom”) makes no guarantee, representation or warranty and accepts no responsibility or liability for the accuracy or completeness of the information and/or opinions contained in this document, including any third party information obtained from sources it believes to be reliable but which has not been independently verified. In no event will Fisdom be liable for any damages, losses or liabilities including without limitation, direct or indirect, special, incidental, consequential damages, losses or liabilities, in connection with your use of this document or your reliance on or use or inability to use the information contained in this document, even if you advise us of the possibility of such damages, losses or expenses. Fisdom does not undertake any obligation to issue any further publications or update the contents of this document. The information stated and/or opinion(s) expressed herein are expressed solely as general commentary for general information purposes only and do not constitute advice, solicitation or recommendation to act upon thereof. Fisdom does not have regard to specific investment objectives, financial situation and the particular needs of any specific person who may receive this document. The information contained within this document has not been reviewed in the light of your personal circumstances. Please note that this information is neither intended to aid in decision making for legal, financial or other consulting questions, nor should it be the basis of any investment or other decisions. Fisdom may have issued other similar documents that are inconsistent with and reach different conclusion from the information presented in this document. The relevant offering documents should be read for further details. You should make such researches/inspections/inquiries as it deems necessary to arrive at an independent evaluation of companies referred to in this document (including the merits and risks involved), and should consult its own advisors to determine the merits and risks involved. Fisdom makes no representations that the offerings mentioned in this document are available to persons of any other country or are necessarily suitable for any particular person or appropriate in accordance with their local law. Among other things, this means that the disclosures set forth in this document may not conform to rules of the regulatory bodies of any other country and investment in the offer discussed will not afford the protection offered by the local regulatory regime in any other country. Past performance contained in this document is not a reliable indicator of future performance whilst any forecasts, projections and simulations contained herein should not be relied upon as an indication of future results. The historical performance presented in this document is not indicative of and should not be construed as being indicative of or otherwise used as a proxy for future or specific investments. The relevant product documents should be read for further details. Fisdom does not undertake any obligation to issue any further publications to you or update the contents of this document and such contents are subject to changes at anytime.
Ready to take your portfolio to the next level? Explore our carefully curated New Year 2025…
This Diwali, we present a portfolio that reflect both sector-specific and stock-specific opportunities. With 2…
Thank you for showing interest in taking a BTST position using our Delivery Plus product.…
Thank you for showing interest in the consultation on trading strategies! Our expert will reach…
Even if you are a new participant in the stock market, the process of buying…

